Blog
- Details
- Blog
By Ayobami Ayorinde, Maryam Ibrahim and Oluchi Nkeonye | Around the middle of July, the Federation Account Allocation Committee (FAAC) shared the revenue generated for the month of June 2026 among the three tiers of government and other statutory recipients. This allocation marks the end of the first half of the 2026 fiscal year, providing an opportunity to examine how FAAC disbursements have evolved over the past six months. In this analysis, we review allocation trends from January to June of 2026 and highlight the implications for fiscal management across the three tiers of government.
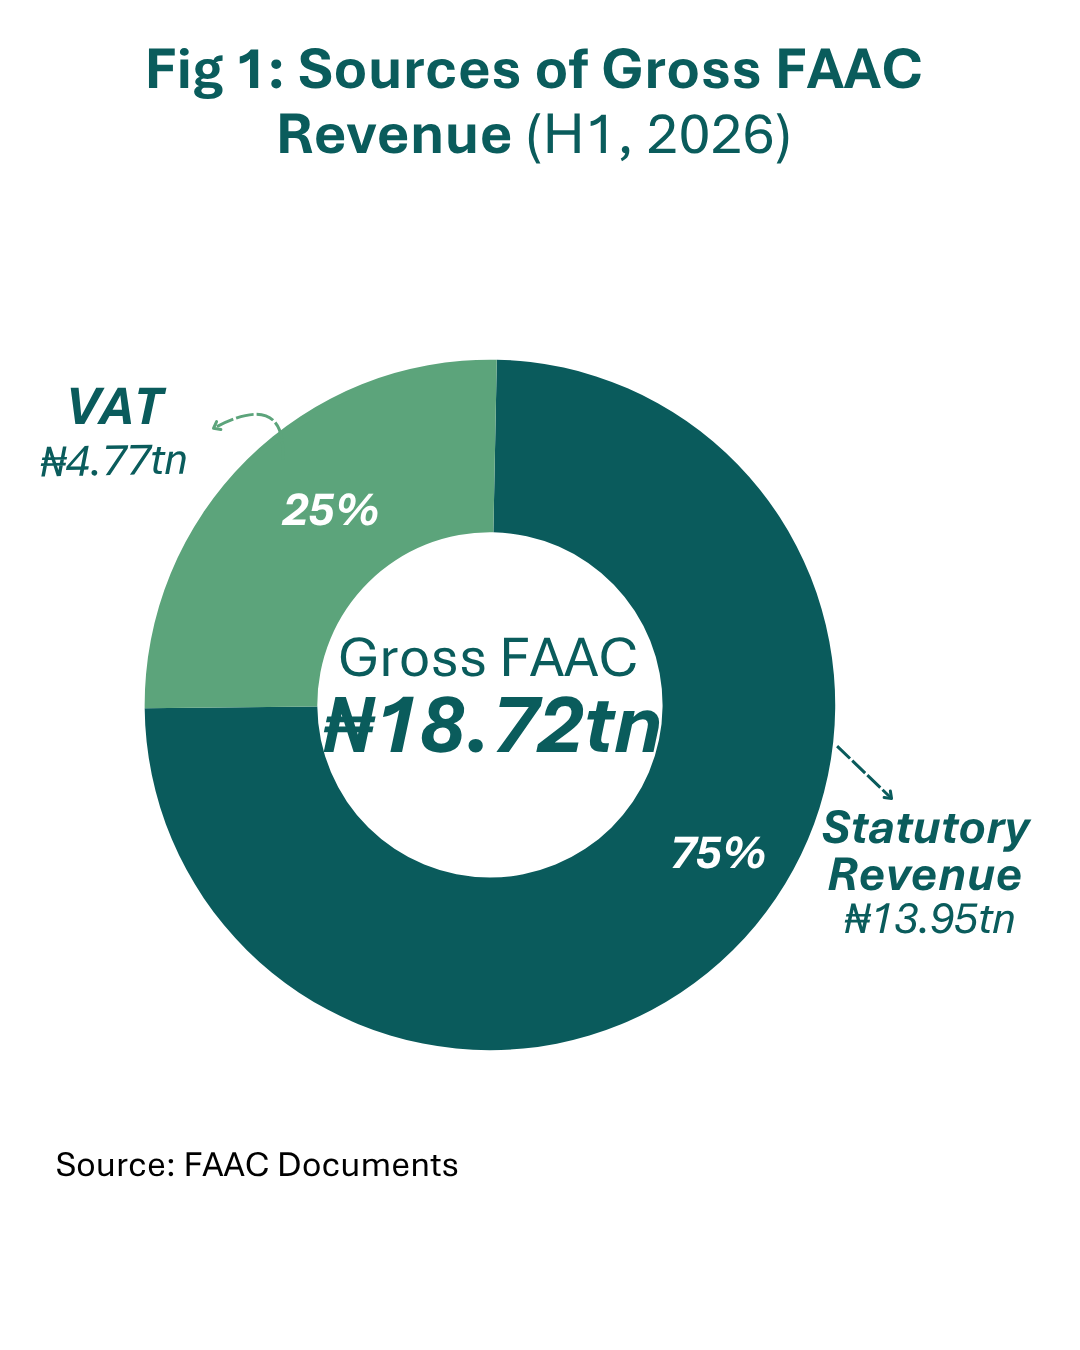
The total gross FAAC revenue in the first half of 2026 was ₦18.72 trillion. Statutory revenue remained the dominant source of FAAC receipts, contributing ₦13.95 trillion, which is equivalent to 75% of the total gross revenue, while VAT accounted for ₦4.77 trillion (25%) as shown in Fig 1.
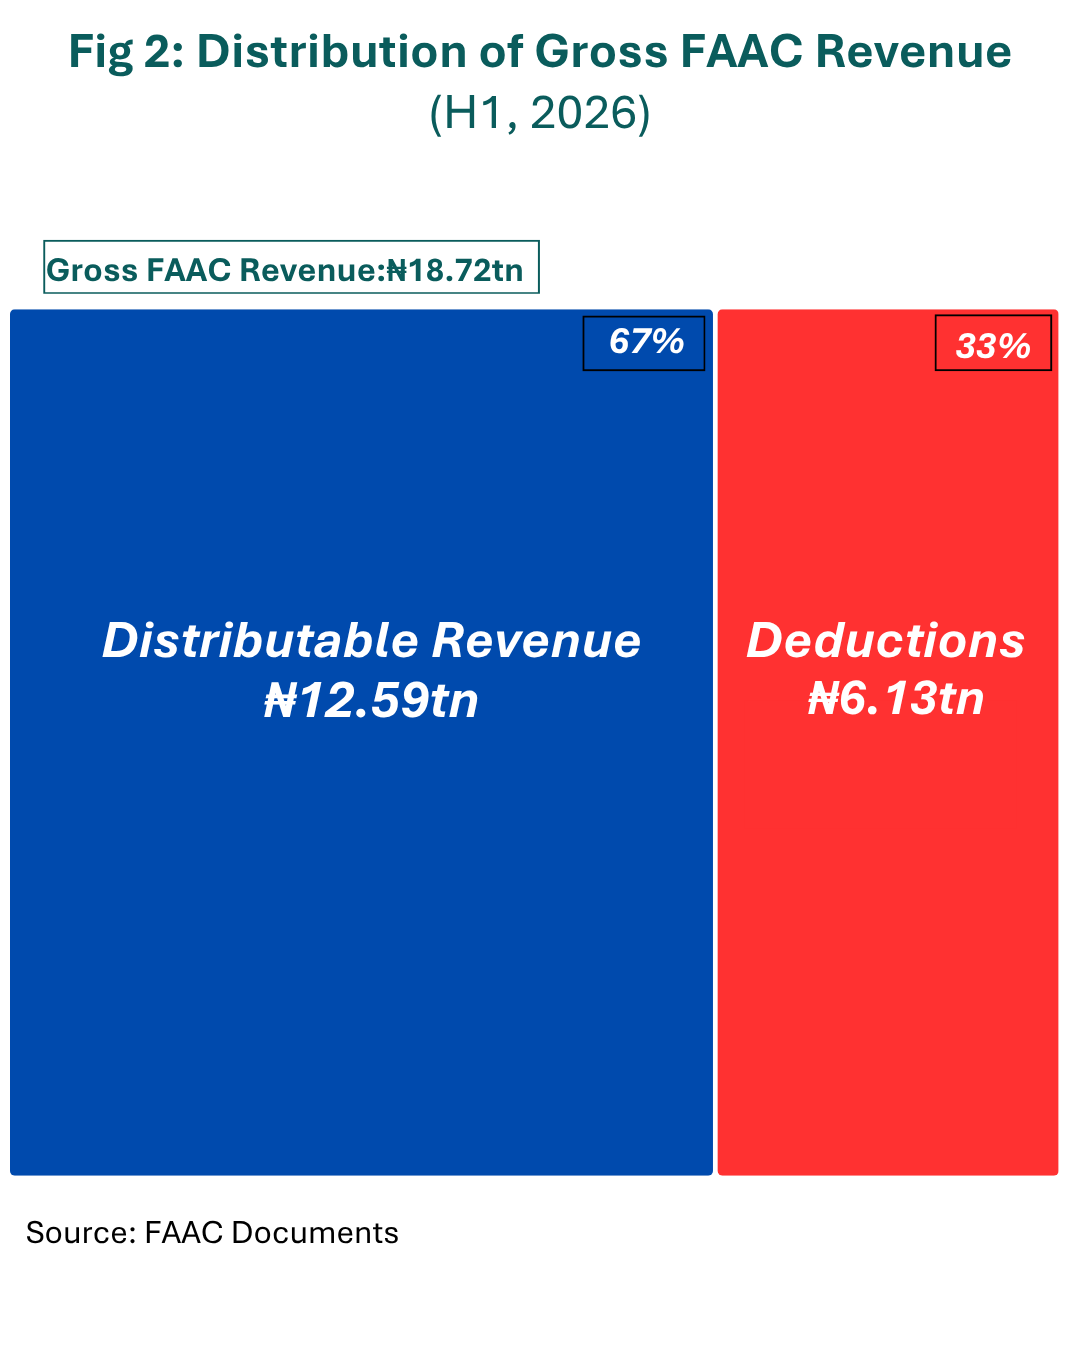
Of the total gross revenue generated during the period, ₦12.59 trillion (67%) was available for distribution to the three tiers of government, while the remaining ₦6.13 trillion (33%) was deducted for savings, interventions, refunds, transfers, and the cost of collection, as seen in Fig 2.
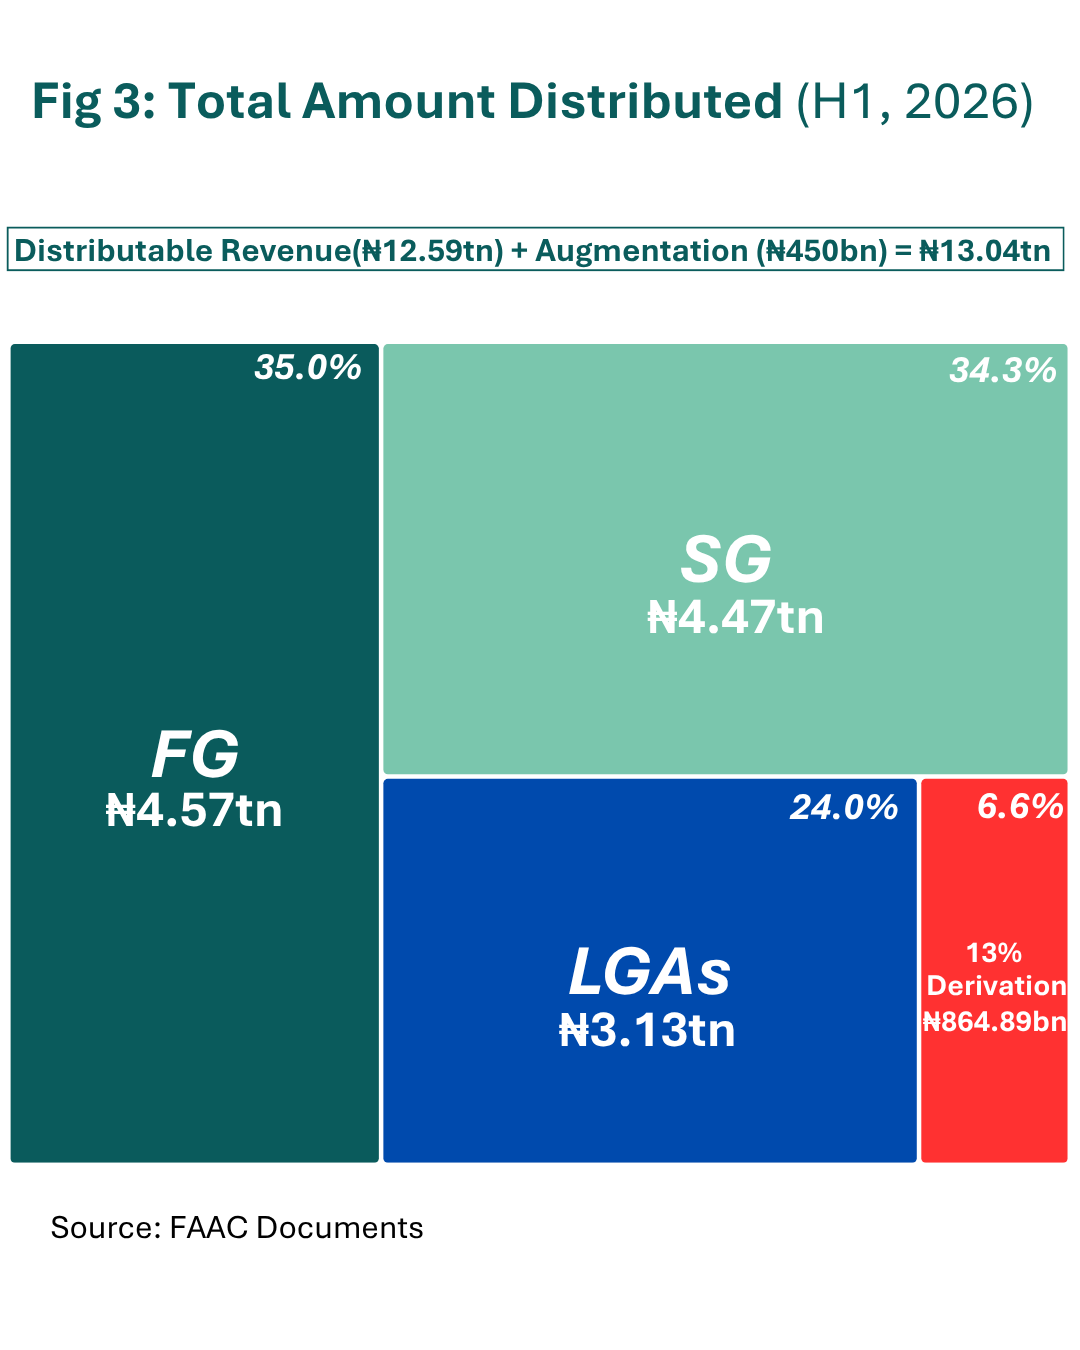
The total distributable revenue and augmentation for the first half of 2026 was shared across the three tiers of government. The Federal Government received ₦4.57 trillion while the 36 states shared ₦4.47 trillion. The 774 Local Government Areas received ₦3.13 trillion while the 13% derivation allocation to oil-producing states amounted to ₦864.89 billion, as shown in Fig 3.
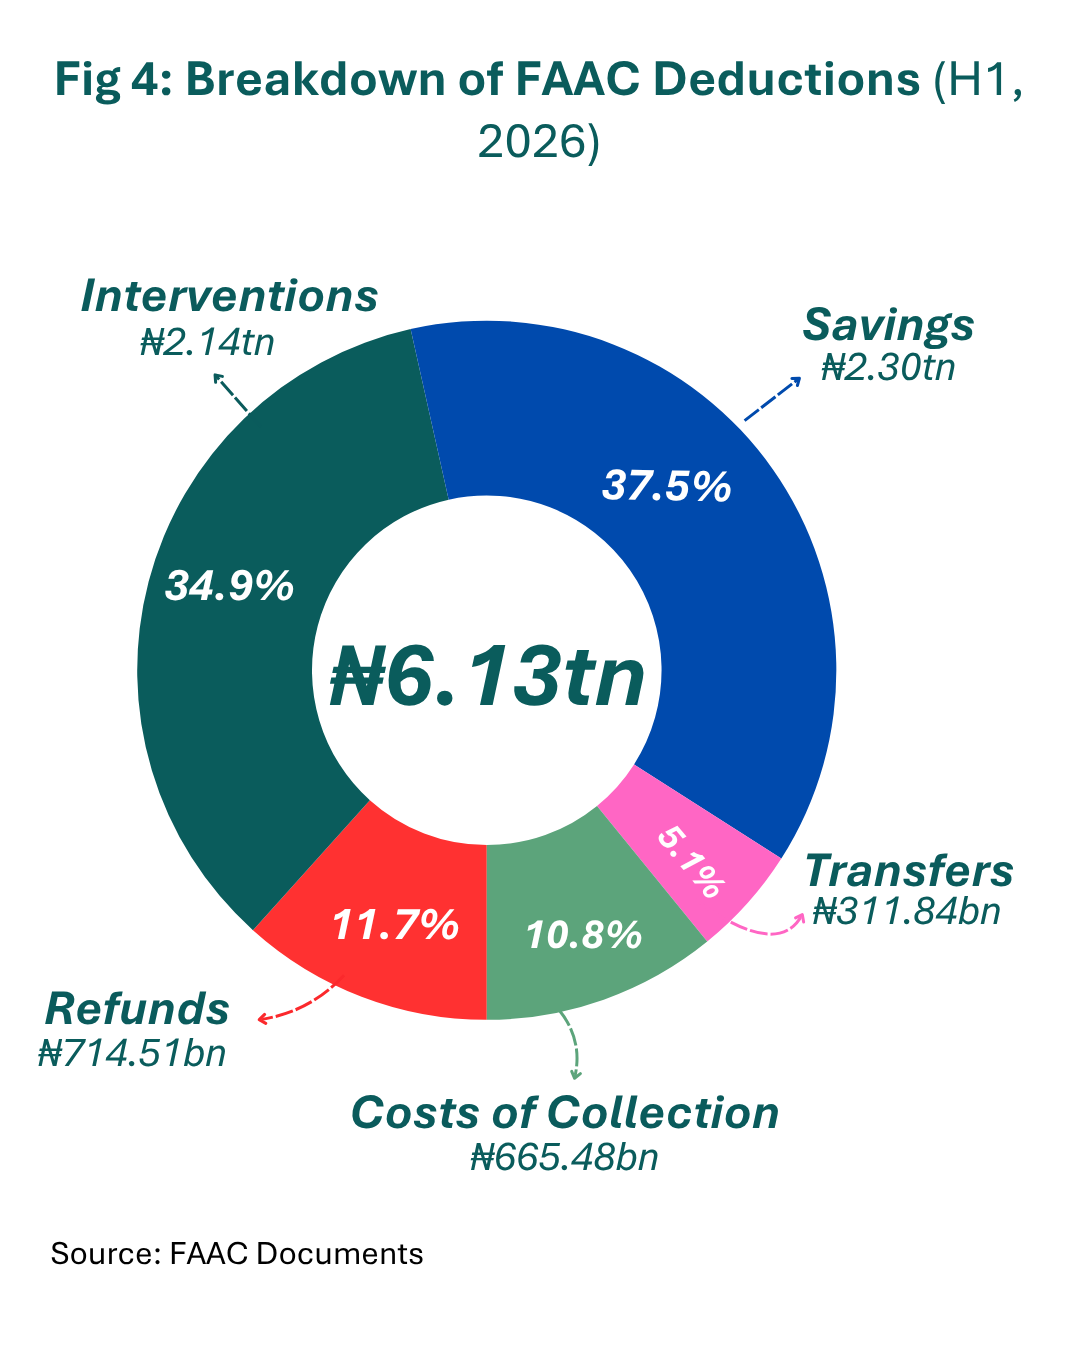
An analysis of the deductions shows that Savings and Interventions accounted for the largest share, amounting to ₦2.30 trillion and ₦2.14 trillion, respectively. These two represented the bulk of all deductions made during the period. Refunds followed at ₦714.51 billion while the Cost of Collection stood at ₦665.48 billion. Transfers, at ₦311.84 billion, were the smallest deduction in the first half of the year, as shown in Fig 4.
Below are some insights from FAAC Disbursements in the first half of 2026.
Half-Year Gross FAAC Revenue Increased by over 300% in Six Years
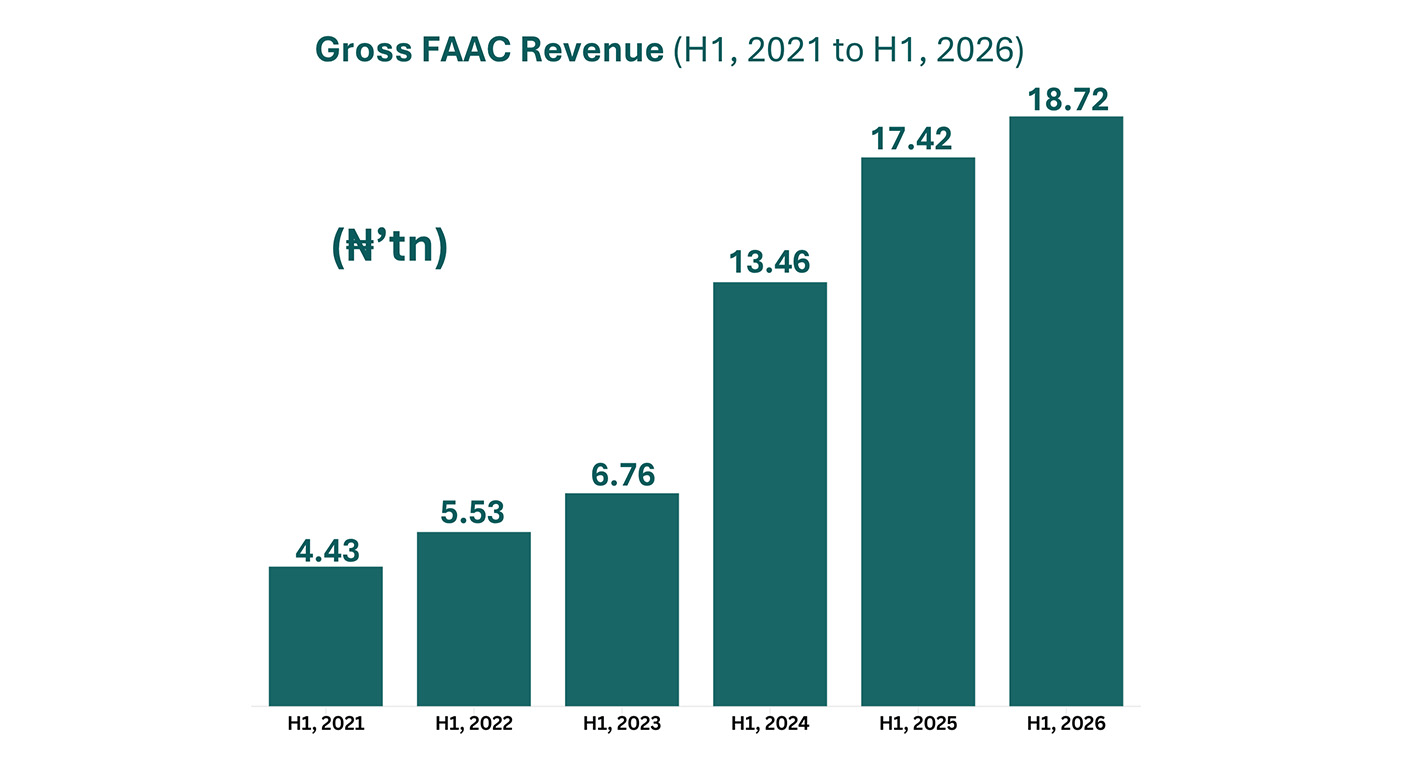
Between the first half of 2021 and the first half of 2026, gross FAAC revenue increased significantly by 323% from ₦4.43 trillion to ₦18.72 trillion as seen in Fig 5. More interesting is that the ₦18.72 trillion generated in just the first six months of 2026 exceeded the entire gross FAAC revenue recorded in each of 2021, 2022, and 2023 in nominal terms as shown in Fig 6.

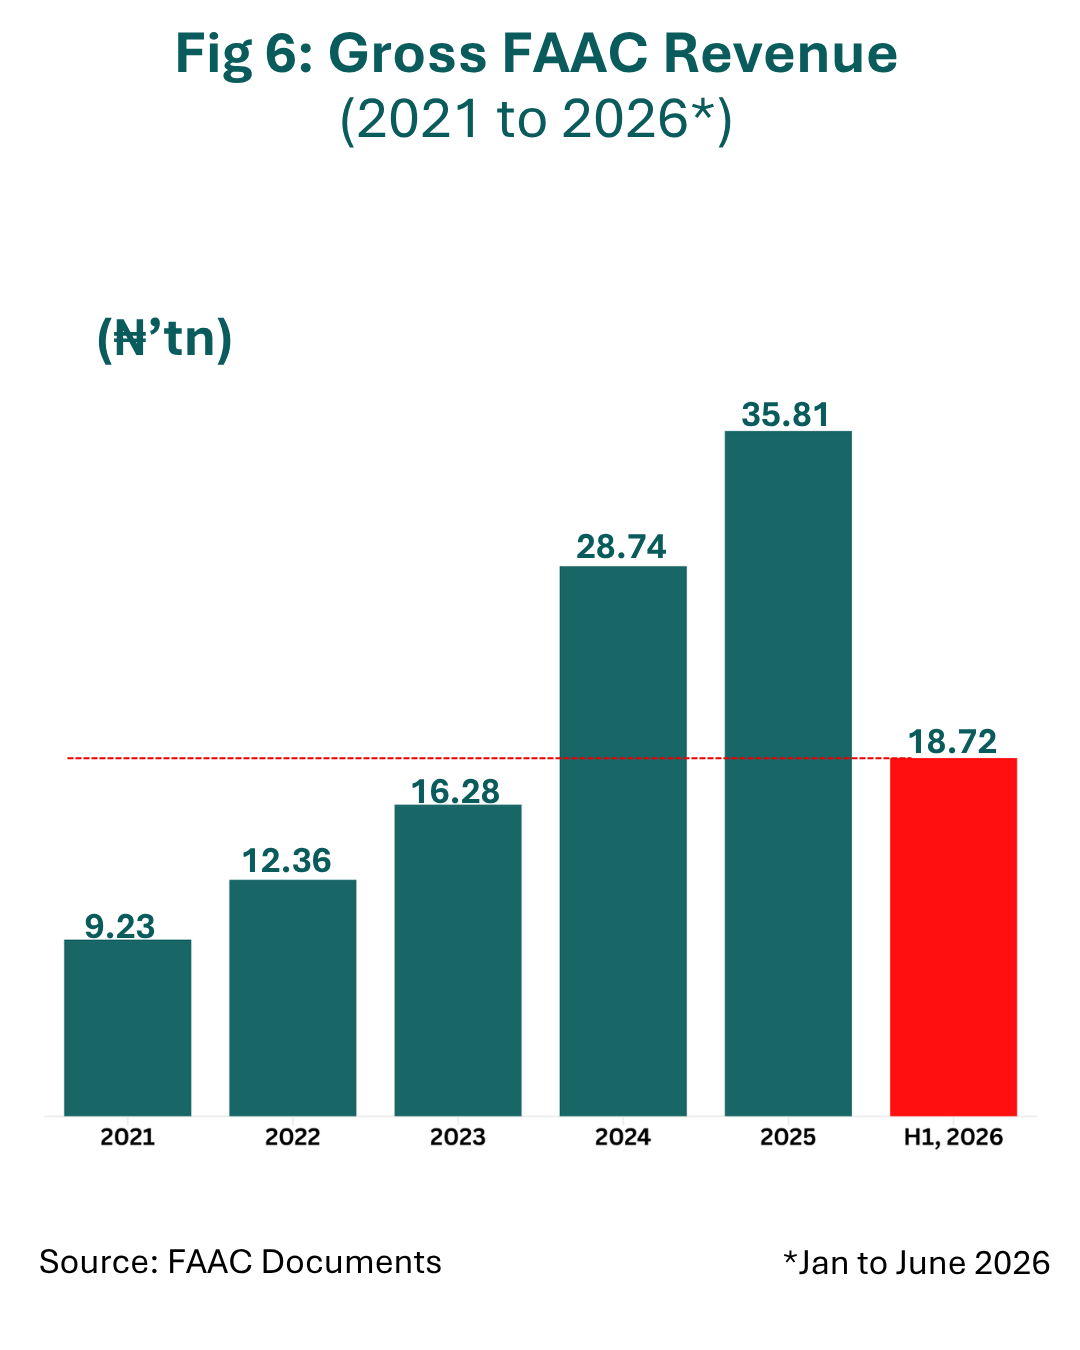
The ₦18.72 trillion generated between January and June 2026 represents 52% of the ₦35.81 trillion gross FAAC revenue recorded for the whole of 2025. If this trend of revenue performance continues in the second half of the year, the gross FAAC revenue for 2026 may exceed that of 2025.
Increase in Distributable Revenue, Decrease in Deductions
Distributable revenue in the first half of 2026 rose by 24.4% from ₦10.12 trillion in H1 2025 to ₦12.59 trillion in H1 2026 as seen in Fig. 7 below. Over the same period, FAAC deductions declined by 16%, falling from ₦7.30 trillion in the first half of 2025 to ₦6.13 trillion in the corresponding period of 2026 as shown in Fig. 8.

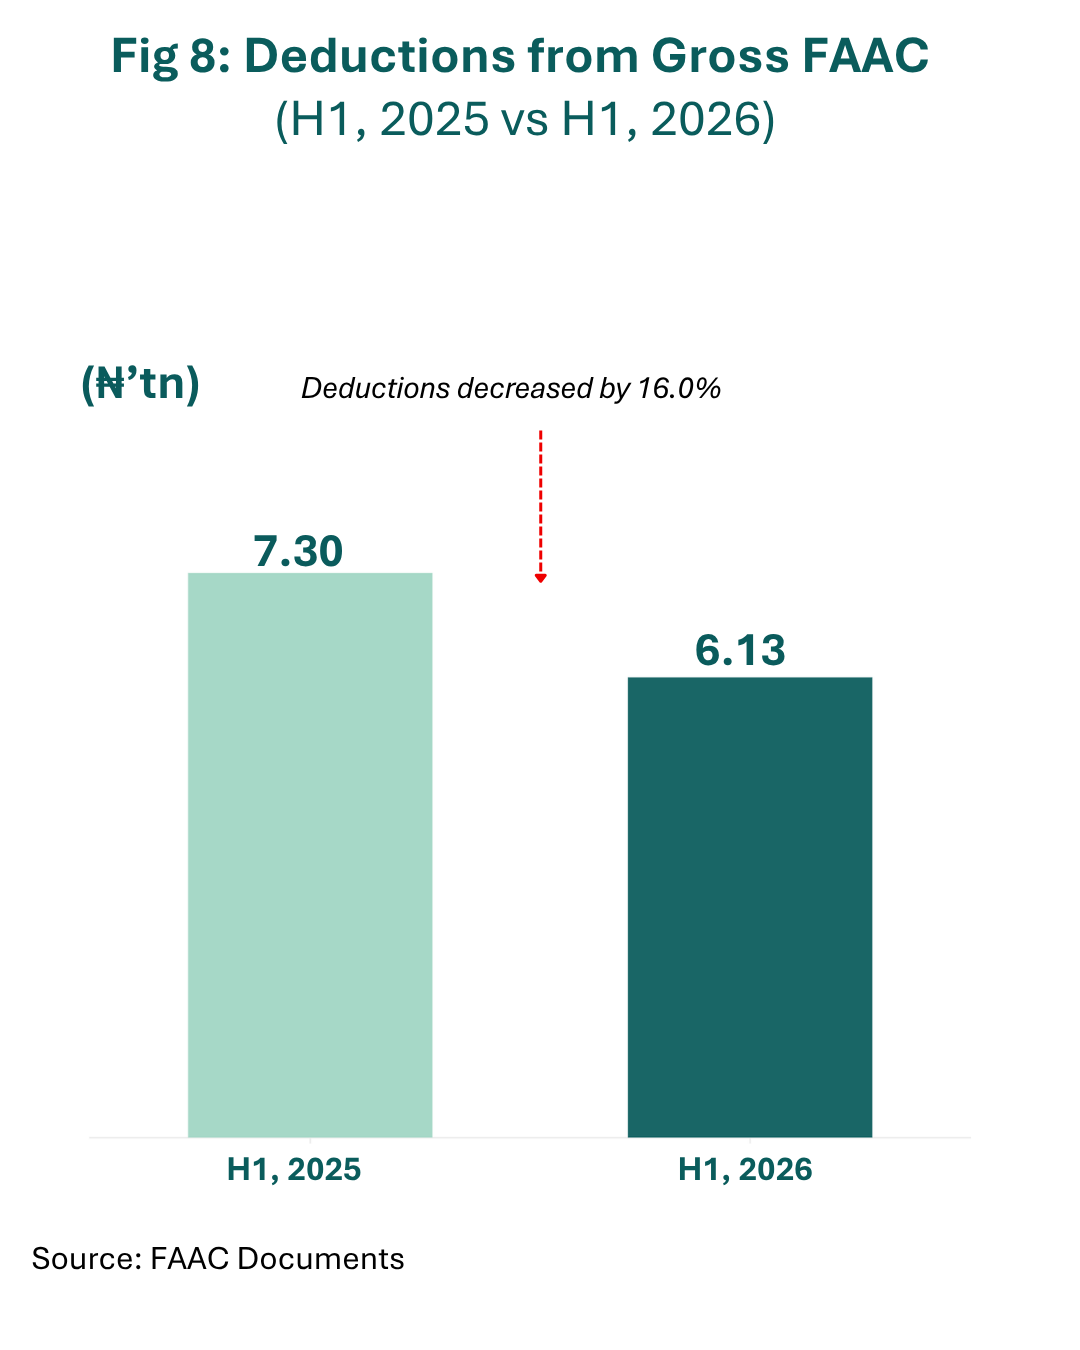
As a result, a larger share of Gross FAAC revenue was available for distribution, with distributable revenue accounting for 67% of Gross FAAC in H1 2026, up from 57% in the same period of 2025.
Less Refunds, More Savings
A notable highlight in FAAC revenue during the first half of 2026 was the sharp decline in refunds as seen in Fig 9. Refunds fell by 80% compared to the corresponding period in 2025, significantly reducing its share of FAAC deductions. In H1 2025, refunds, largely comprising payments to states and local governments, accounted for 47% of total FAAC deductions. By H1 2026, that share had dropped to just 12%.
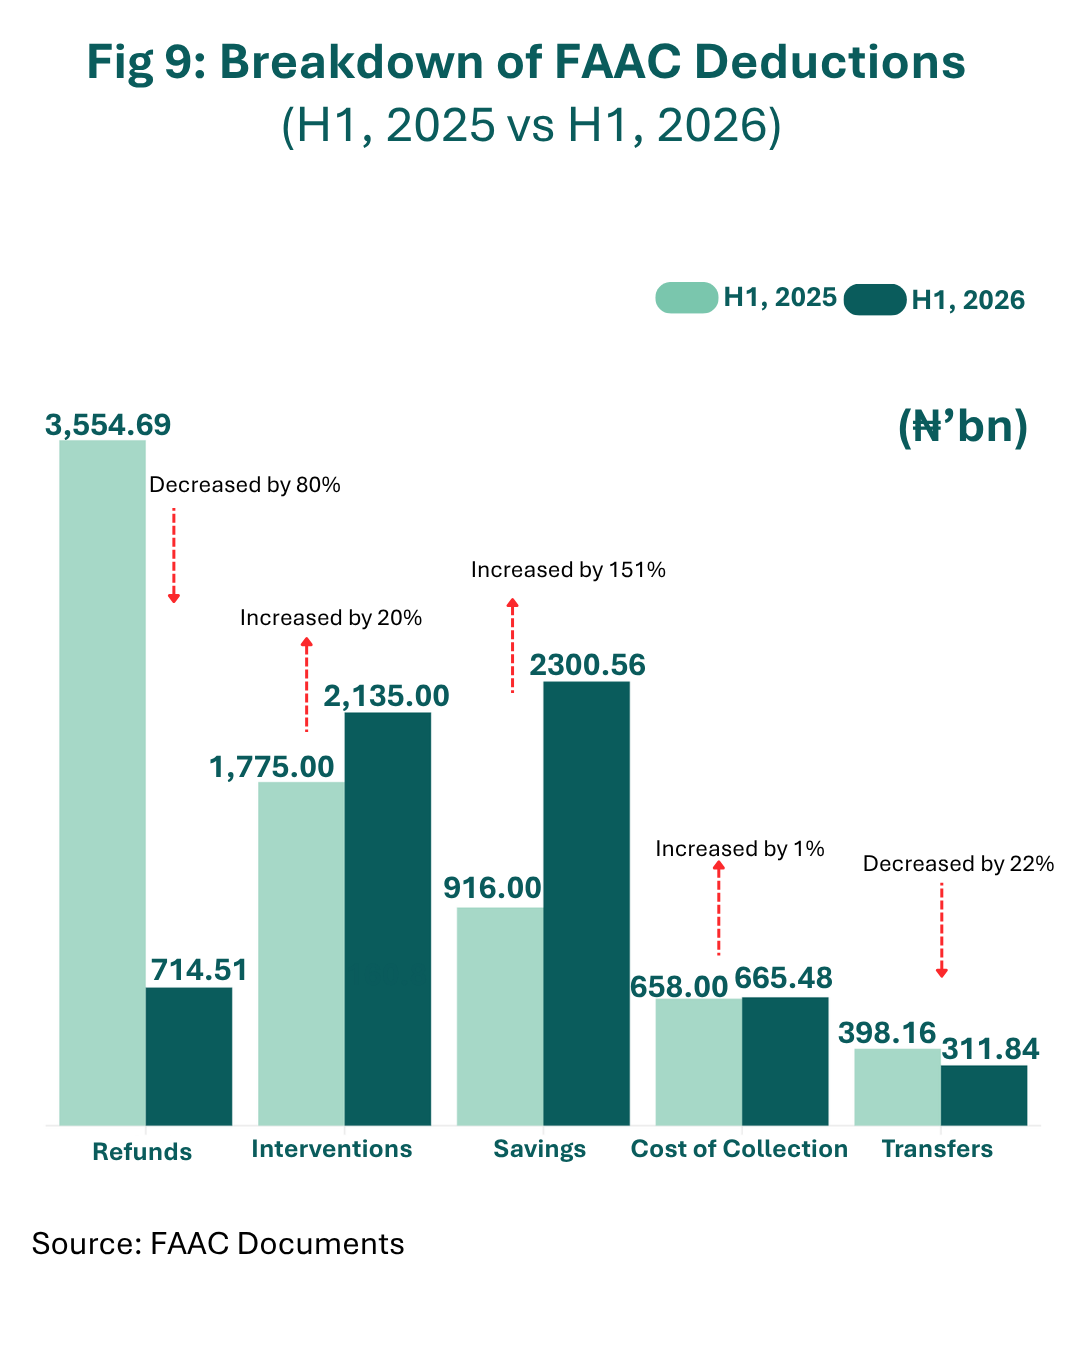
On the other hand, savings from Gross FAAC revenue increased substantially by 151% and became the largest component of FAAC deductions in H1 2026, accounting for 37% of total deductions from 15% in the corresponding period of 2025. Despite this, more money was allocated to Interventions between April to June 2026, particularly for national and state security, and state infrastructure. The breakdown of allocations to Interventions in the first half of 2026 is as follows: National Security Fund (₦ 1 trillion), Infrastructure Development Fund for States (₦777 billion), Military Intervention Fund (₦250 billion) and Intervention for State Security (₦108 billion).
Federal Government Regains Largest Share of Distributable FAAC Revenue
The distribution of Gross FAAC revenue shifted in favour of the Federal Government in the first half of 2026. Unlike the corresponding period of 2025, when the 36 states collectively received a slightly larger share of distributable FAAC allocations than the federal government, the federal government regained the top spot in H1 2026. In H1 2025, the states received a combined ₦3.43 trillion, marginally exceeding the Federal Government's ₦3.39 trillion as shown in Fig 10 below.

However, in H1 2026, the Federal Government's allocation increased to ₦4.57 trillion, surpassing the ₦4.47 trillion allocated to the states combined. However, a reallocation of the deductions (which go mostly to states) combined with derivation (which goes only to states), shows that the states get a higher portion of FAAC revenue than the FG.
June Remains the Month with the Highest Gross FAAC Revenue in the First Half of the Year
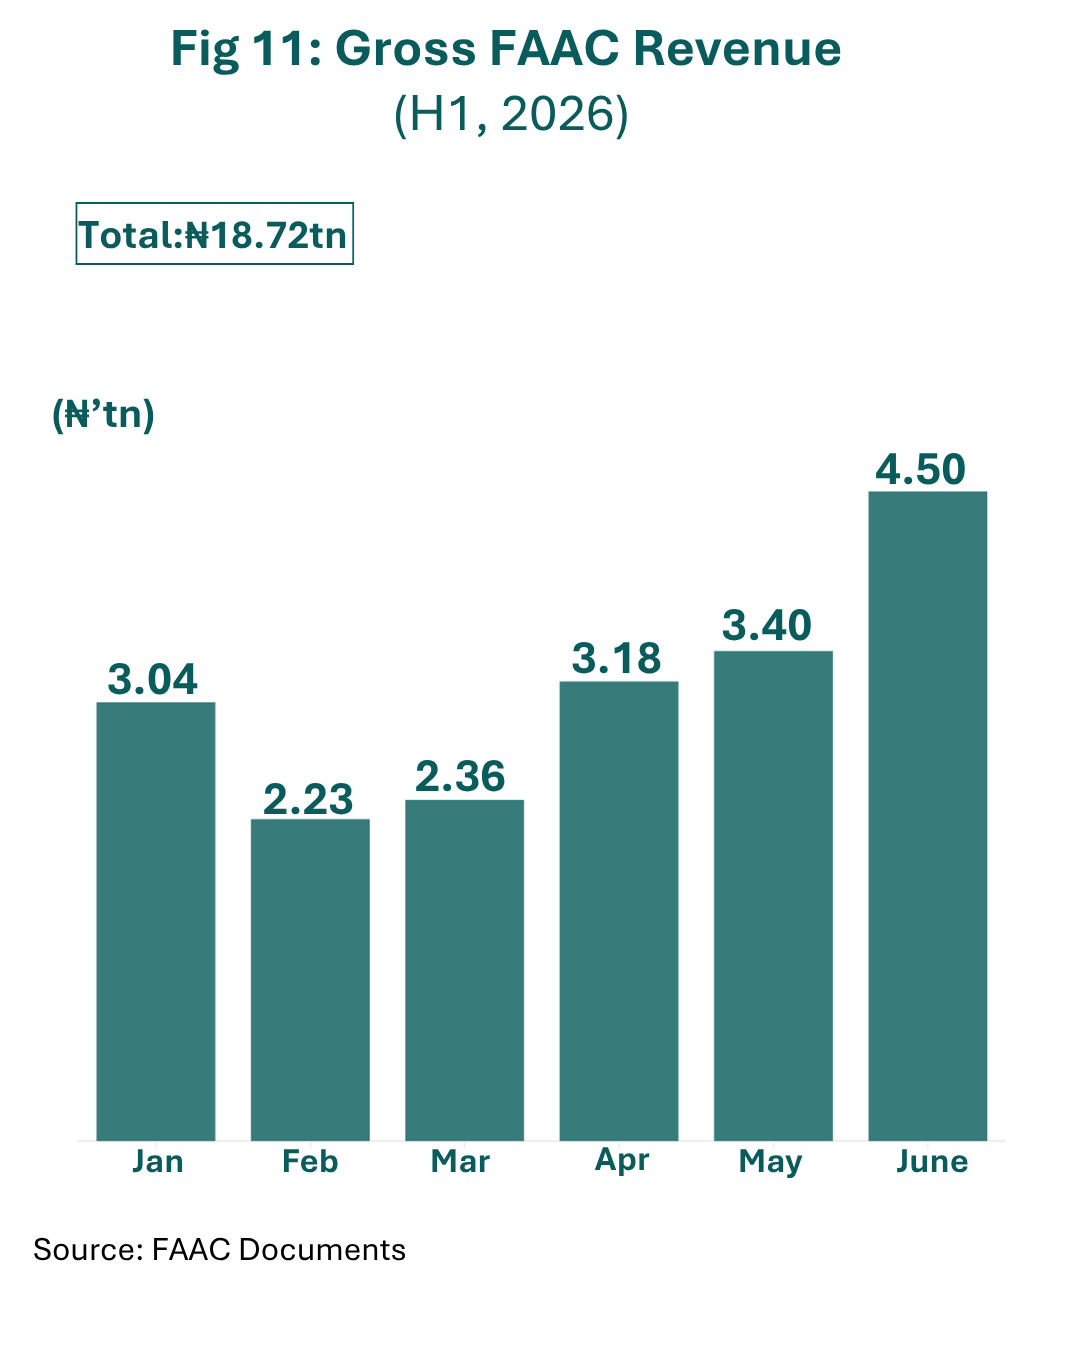
Just as it was in the first half of 2025, June recorded the highest Gross FAAC revenue in H1 2026 at ₦4.50 trillion as seen in Fig 11. This was likely driven by higher Company Income Tax (CIT) collections and other annual tax remittances typically due in June. In contrast, February recorded the lowest Gross FAAC revenue at ₦2.23 trillion, mirroring the trend observed in the corresponding period of 2025.
Lagos and Oyo Record the Highest Gross FAAC Increases
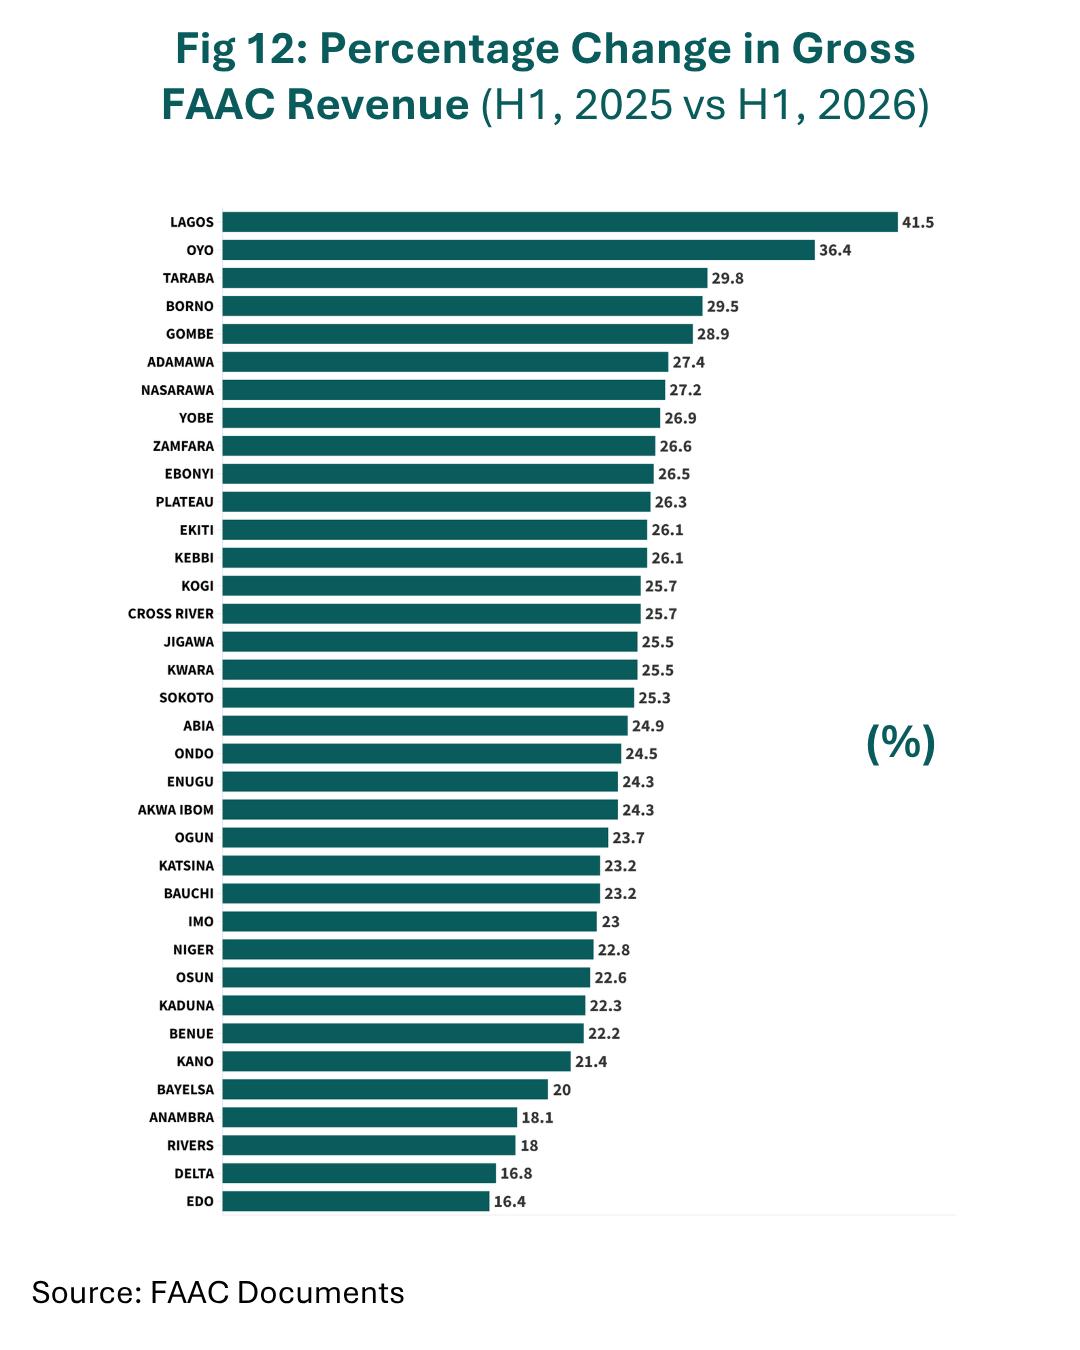
In terms of year-on-year growth, Lagos and Oyo states recorded the largest increases in Gross FAAC allocations by 41.5% and 36.4% respectively. By contrast, Edo and Delta posted the lowest increase with their allocations rising by 16.4% and 16.8%, respectively as shown in Fig 12.
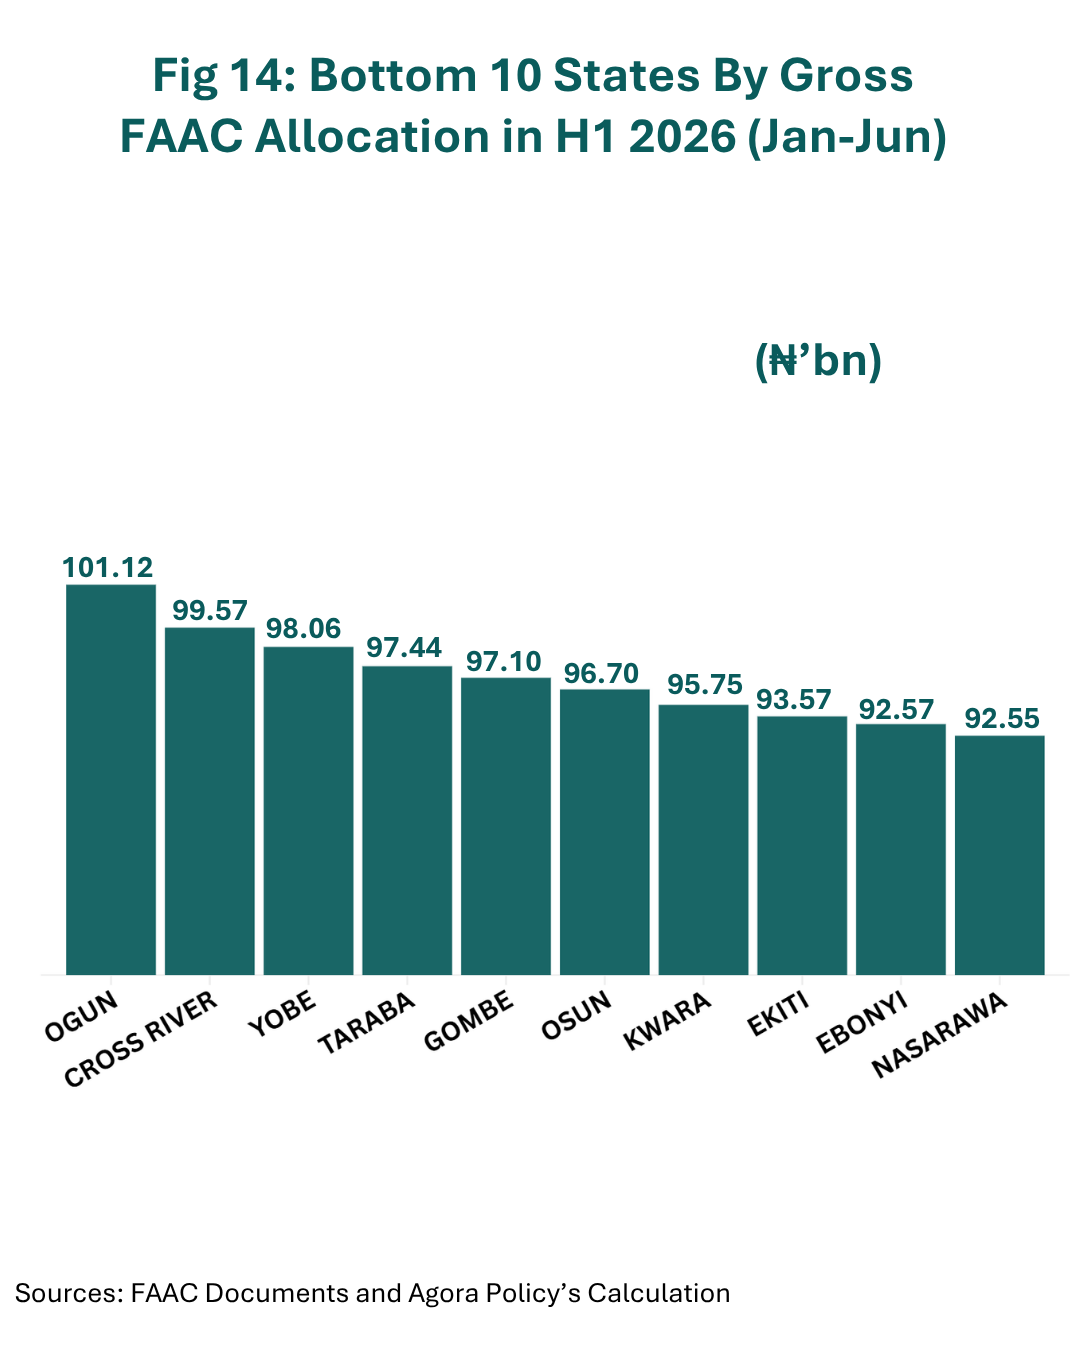
Meanwhile, Lagos remained the largest recipient of Gross FAAC allocations in the first half of 2026, receiving ₦477.05 billion, while Nasarawa received the least at ₦72.78 billion. The composition of the top and bottom recipients changed slightly compared to H1 2025. Ondo entered the top 10 states by Gross FAAC allocation, replacing Edo, which dropped out of the top 10. At the lower end of the ranking, Ogun joined the bottom 10 states, while Zamfara moved out of the group as seen in figures 13 and 14.

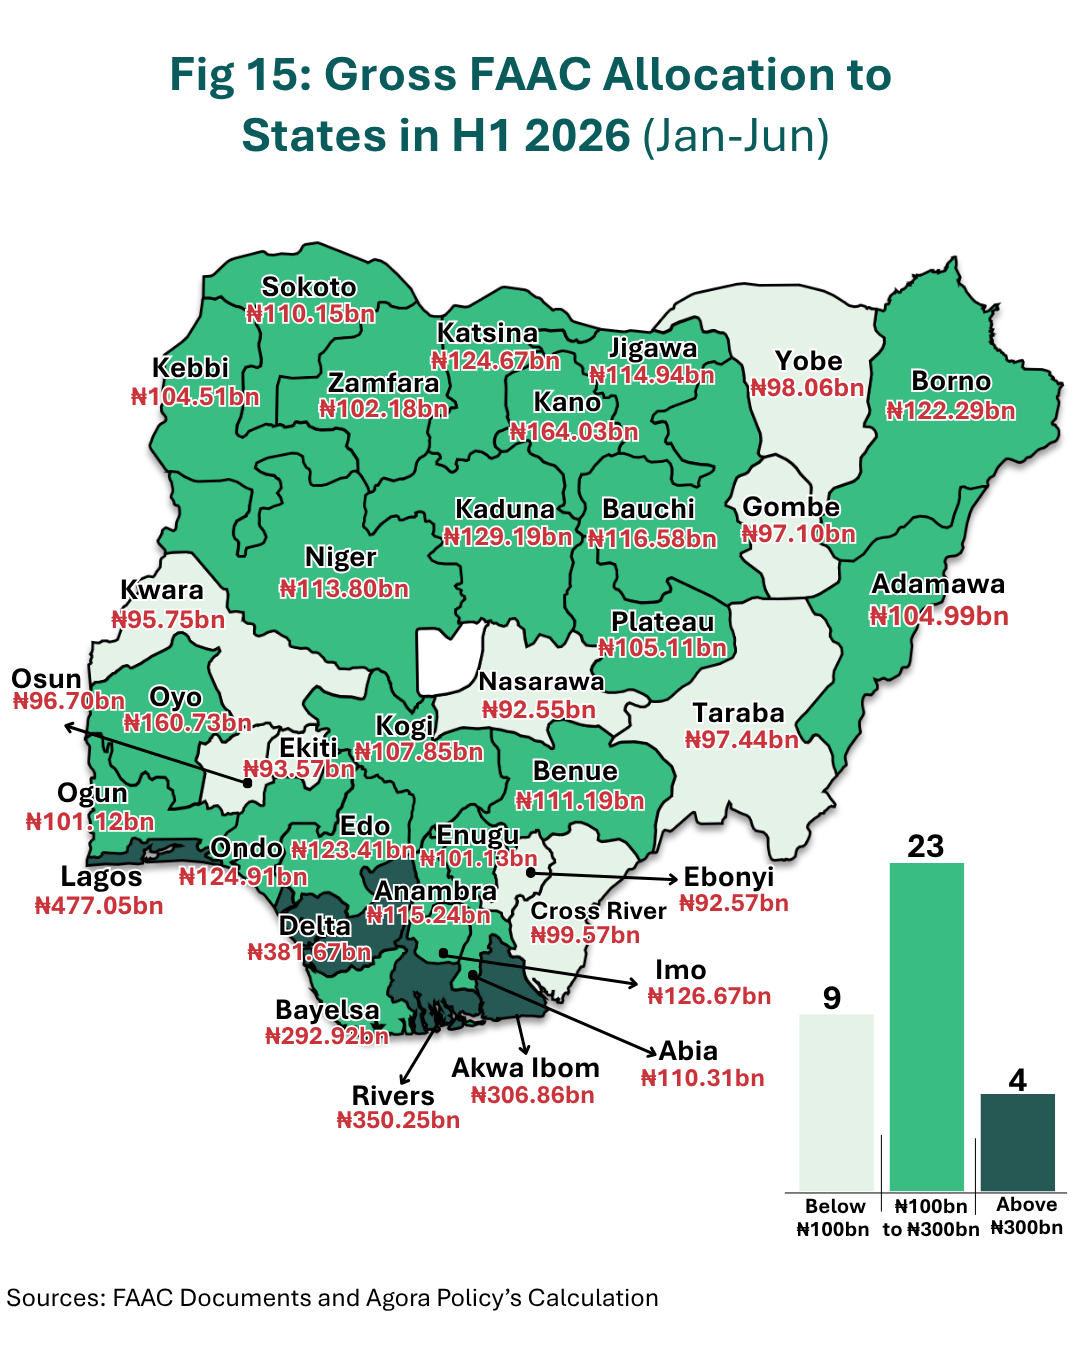
Twenty of the 36 states received between ₦100bn to ₦300bn in gross FAAC allocation. Nine states received less than ₦100bn while Lagos, Delta, Rivers and Akwa Ibom each received over ₦300bn as shown in Fig 15.
Having More LGAs Does Not Necessarily Mean Higher FAAC Revenue
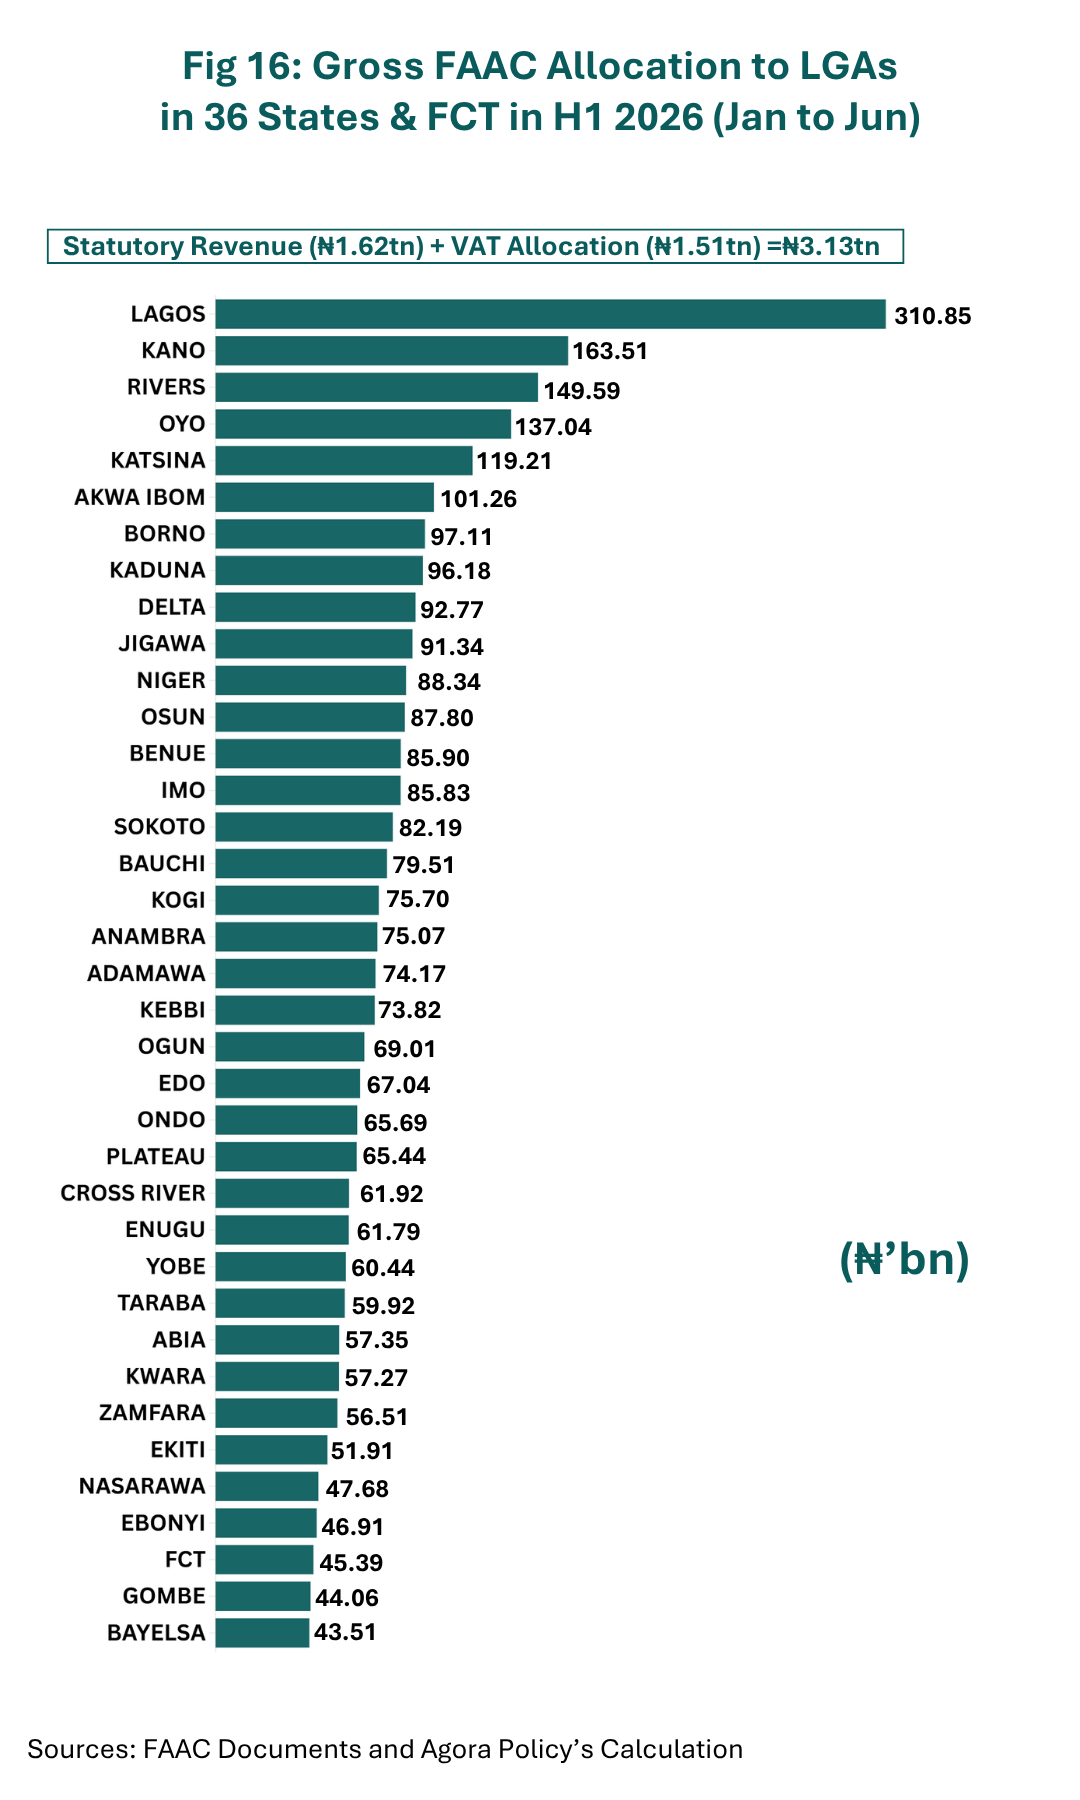
Although Kano has the highest number of LGAs (44), its combined gross FAAC allocation of ₦163.5 billion to its LGAs was only the second highest and was nearly half of the ₦310.85 billion received by the 20 LGAs of Lagos. Similarly, Rivers, with 23 LGAs, received a higher gross FAAC allocation to its LGAs than Oyo and Katsina, despite having 33 and 34 LGAs, respectively, as seen in Fig 16. This pattern appears recent, and is likely on account of the growing prominence of Value Added Tax (VAT) as a source of FAAC revenue. LGAs receive 35% of VAT revenue, and states with urban and commercial LGAs with a high level of consumption, like Lagos and Rivers, stand at an advantage, even with fewer number of LGAs.
Conclusion
The first half of 2026 marked a marginally better FAAC performance than the corresponding period of 2025, with higher gross FAAC revenue, a larger distributable pool, and lower deductions. But improved allocations alone may not translate to better development outcomes unless accompanied by more efficient spending across the three tiers of government. Equally important is the need to strengthen transparency and accountability mechanisms to ensure that public resources deliver measurable value for citizens. Therefore, as revenues improve, the emphasis should increasingly shift from the size of allocations to how effectively public resources are deployed to improve infrastructure, public services and the welfare of Nigerians.
- Details
- Blog
By Hafsat Abubakar Bakari | It is an honour and privilege to be here at this triple-header event: the graduation of the second cohort of the Policy Writing Fellowship, and the official unveiling of the Local Governance Accountability (LGA) Portal and the Policy Registry.

- Details
- Blog
By Ola Olukoyede | I am honoured by the invitation as Special Guest and the opportunity to give a goodwill message at this memorable occasion. It was not difficult putting aside my other engagements to be here, as I have come to appreciate Agora Policy as an extremely innovative and resourceful think tank committed to leaving a mark in our policymaking environment.

- Details
- Blog
By Ayobami Ayorinde and Seyi Akinbodewa | Almost all the states in Nigeria have published their four quarterly budget implementation reports for the year 2025. This is commendable and needed, especially in a country where many citizens and civic groups clamour for fiscal transparency and accountability. The Federal Government, on the other hand, has lagged behind in meeting the same standard. The most recent quarterly budget implementation report released by the Federal Government covers Q2 2025. Yet, the Fiscal Responsibility Act (2007) requires all governments to publish a summary report of budget execution within 30 days of the end of each quarter.
The State Fiscal Transparency, Accountability and Sustainability (SFTAS) programme (2018-2022), a performance-for-results programme initiated by the Federal Government but implemented by the World Bank, contributed to improving fiscal openness at the subnational level. Although the SFTAS programme ended four years ago, the continued release of quarterly budget implementation reports shows that the initiative has been largely sustained across states. This regular disclosure opens room for accountability and allows for residents and citizens to ask crucial and informed questions about how states generate and spend their revenues.
The budget implementation reports of states for 2025 provide comprehensive information on the fiscal performance of 35 states in the course of the year. The report excludes Rivers State because the state did not publish any BIR for the year, possibly on account of the state of emergency in the state for six months in 2025. In this analysis, we examine revenue generation and expenditure patterns and assess their performance relative to final budget estimates.
Expenditure and Revenue of States
In 2025, 35 out of 36 states recorded a combined expenditure of ₦19.21 trillion. This is a 37% increase from the ₦14.05 trillion recorded in 2024. On the other hand, their total revenue amounted to ₦16.64 trillion in 2025, a 24% increase from ₦13.39 trillion in 2024, as seen in Fig 1. As a result, the budget deficit as a percentage of revenue increased from 4.9% in 2024 to 15.4% in 2025. This shows that even when revenue increased, the deficit also increased because states’ expenditure outpaced their income.

As shown in Fig 2 below, Lagos generated the highest revenue in 2025 at ₦2.63 trillion, followed by Delta (₦1.45 trillion) and Akwa Ibom (₦1.11 trillion). At the lower end in terms of revenue were: Zamfara (₦204.9 billion), Kebbi (₦191.2 billion) and Nasarawa (₦188.6 billion). Notably, Lagos (₦2.84 trillion), Akwa Ibom (₦1.33 trillion), and Delta (₦1.15 trillion) also recorded the highest expenditure in 2025, as seen in Fig 3 below. On the other hand, Zamfara (₦254.4 billion), Kebbi (₦239.8 billion), and Taraba (₦195.5 billion) had the least spending for the year.


States' Budget Expenditure Performance
In 2025, 35 out of the 36 states combined achieved a budget implementation rate of 68.2%, just 1.8% lower than the rate achieved by all 36 states in 2024, as seen in Fig 4. Of the ₦19.21 trillion spent, a total of ₦11.87 trillion (62%) went to capital projects while ₦7.34 trillion (38%) went to recurrent costs as seen in Fig 5 below. When compared with the 58% and 42% that went to capital and recurrent expenditure, respectively in 2024, it shows that states are directing a larger share of their expenditure toward capital projects. This pattern is also reflected in the 2026 budget proposals, where 33 states allocated more than 50% of their budgets to capital spending.


For the 35 states reviewed, recurrent expenditure achieved an implementation rate of 79%, while capital expenditure was 62.9%, as shown in Fig 6. Anambra (80%), Enugu (79%), Abia (79%), Imo (78%), Akwa Ibom (77%) and Bayelsa (77%) recorded the highest capital spending in percentage terms while Plateau (67%), Kogi (66%), Osun (62%), Ekiti (62%), Taraba (61%) and Ondo (60%) led in recurrent expenditure as seen in Fig 7 below.


Out of the 34 states, six implemented less than half of their final budgets. The affected states are: Taraba (34%), Kebbi (41.3%), Abia (45.5%), Niger (47.1%), Plateau (47.5%) and Cross River (48.9%). However, the states that surpassed 80% implementation rate are Yobe (99.8%), Delta (97.2%), Ekiti (87.9%), Bauchi (85.6%), Lagos (84.3%), Osun (82.2%), Bayelsa (82%) and Akwa Ibom (80.6%) as seen in Fig 8 and 9.


Taraba (20.1%), Plateau (26.2%), Kebbi (34.6%), Kwara (37.7%), Cross River (38.2%), Niger (39.4%), Adamawa (39.8%), Abia (46%), Ebonyi (46.3%), Ogun (47%) and Ondo (49.3%) implemented less than half of their capital budgets. Meanwhile, Yobe (106.4%), Delta (99.9%), Lagos (85.6%), Akwa Ibom (83.9%), and Bayelsa (82.4%) each recorded over 80% in capital budget implementation as shown in Fig 10 and 11 below.


On the other hand, 18 states recorded recurrent expenditure implementation rates above 80%, while Abia was the only state that failed to reach 50% as seen in Fig 12 and 13.


States’ Budget Revenue Performance
In 2025, 35 out of the 36 states combined achieved 88.4% of their total projected revenue as seen in Fig 14, unlike 2024 where 36 states combined recorded a 5% revenue increase above budgeted figures due to higher FAAC allocations. The shortfall in 2025 can be attributed to some states setting overly ambitious revenue projections for the year, possibly based on the 2024 outturn. Out of the ₦16.64 trillion in actual revenue in 2025, ₦12.40 trillion (75%) was from FAAC, while ₦4.24 trillion (25%) was through IGR, as shown in Fig 15.


The reviewed states received 91.6% of their total projected FAAC revenue in 2025, as seen in Fig 16 below, while their combined IGR fell short by 21% compared to projections.

Lagos (₦2.6 trillion), Delta (₦1.5 trillion), Akwa Ibom (₦1.1 trillion), Bayelsa (₦976.9 billion), Enugu (₦665.9 billion) Edo (₦511.2 billion), Kano (₦486.8 billion), Oyo (₦467.9 billion), Ogun (₦436.5 billion) and Anambra (₦390.3 billion) are the states with the highest revenue in 2025 as shown in Fig 17. The zonal distribution of the Top 10 states in terms of revenue is as follows: South South (four), South West (three), South East (two) and North West (one). Nine of these states are from the South, while only Kano is from the North. On the flip side, Nasarawa (₦188.6 billion), Kebbi (₦191.2 billion), Zamfara (₦204.9 billion), Ebonyi (₦234.9 billion), Adamawa (₦235.5 billion), Taraba (₦249.3 billion), Yobe (₦262.2 billion), Gombe (₦264.9 billion), Ekiti (₦275.6 billion) and Plateau (₦289 billion) are the states with the lowest revenue generated as shown in Fig 18. Among the 10 states at the lower end, eight are from the North, while two (Ebonyi and Ekiti) are from the South.


IGR accounted for over half of total revenue in Lagos (70%), Enugu (61%) and Ogun (54%), while states like Bayelsa (5%), Yobe (6%), and Sokoto (7%) recorded less than 10% of their revenue from IGR, as seen in Fig 19 below.

Lagos recorded by far the highest IGR in 2025 at ₦1.85 trillion, more than the other top nine states combined. On the flip side, Yobe (₦15.4 billion), Taraba (₦17.9 billion) and Kebbi (₦18.4 billion) recorded the least, as shown in Fig 20 and 21 below.


Delta (₦1.24 trillion), Akwa Ibom (₦1.02 trillion) and Bayelsa (₦924.7 billion) received the highest revenue from FAAC, while Nasarawa (₦149.2 billion), Kebbi (₦172.8 billion) and Zamfara (₦174.8 billion) got the lowest, as seen in Fig 22 and 23 below


In 2025, Delta (133.3%), Ondo (119.9%), Plateau (119.1%), Imo (112.9%), Ekiti (112%), Anambra (102.8%) and Yobe (102%) recorded revenues (FAAC and IGR) exceeding their budget projections, while 27 states fell short of their targets as seen in Fig 24 and 25 below


Out of the 35 states, Plateau (135.6%), Delta (131.1%), Lagos (125%), Ondo (122%), Abia (117.6%), Imo (116.8%), Ekiti (113.1%), Enugu (112.5%), Sokoto (109%), Jigawa (108.5%), Anambra (105.1%), Osun (102.5%) and Yobe (101.7%) received more FAAC revenue than budgeted, while 22 states recorded lower-than-projected FAAC allocations as seen in Fig 26 and 27 below.


Eight states – Delta (148.4%), Borno (118.9%), Gombe (111%), Ondo (107.8%), Ekiti (107.7%), Yobe (105.9%), Kogi (104.4%) and Kwara (103.5%) generated more IGR than projected in their budgets, while 26 fell short of their IGR targets as shown in Fig 28 and 29 below.


Conclusion and Recommendations
The figures from the report show that states’ revenue and expenditure grew in 2025 compared to 2024 by 24% and 37% respectively. The average budget implementation rate of 68% also shows that about a third of planned spending did not happen. Recurrent spending implementation across the states however, is high, with 18 states recording implementation rates above 80%. This is evidenced by the fact that only 11 states implemented less than half of their capital budgets. The stronger performance of recurrent spending relative to capital expenditure means that states still always have to pay salaries and fund operational costs as at when due. While capital projects are essential for long-term development, recurrent expenditure, which covers operational costs and workers’ salaries, particularly in critical sectors such as education and health, is equally important. If states are able to significantly expand their revenue bases in the coming years, they will have more fiscal space to invest more in capital projects. This is very relevant given that about 90% of states budgeted more for capital expenditure than for recurrent spending in their 2026 budgets. This is where realistic forecasting comes into play. States need to strengthen the basis of their budget projections to ensure that revenue and expenditure estimates are achievable. Without credible assumptions behind projections, states may continue to fall short of their budget targets.
With states becoming more consistent in disclosing their fiscal data, this should encourage citizens, Civil Society Organisations (CSOs) and the media to ask questions and demand accountability on how money is spent and what it is spent on at the sub-national level. Beyond the size of spending, the quality of spending is equally important. High budget implementation rates are commendable, but ensuring that funds are used efficiently and deliver meaningful outcomes should remain a priority. Therefore, strengthening revenue generation and improving fiscal discipline will be essential to ensuring that public spending translates into tangible socio-economic benefits for citizens.

- Details
- Blog
By Adebayo Ahmed | On the 28th of February 2026, the war between USA/Israel and Iran broke out, with immediate devastating consequences for people living in Iran and the rest of the Middle East. But the crisis is also having rippling effects across the world, including in Nigeria. The reasons are copious. First, Iran is a significant producer of crude oil and natural gas.

- Details
- Blog
Twenty-five Nigerians have been selected to participate in the second cohort of the Agora Policy Writing Fellowship, which is organised with the support of the MacArthur Foundation and designed to strengthen policy writing skills and deepen data-driven policy engagement in Nigeria.

- Details
- Blog
By Samuel Ajayi | On 7th December 2025, news broke of an attempted coup in neighbouring Republic of Benin, which President Patrice Talon later announced had been foiled. Some of the online reactions to the attempted coup highlighted a disturbing rise in sympathy for military regimes across West Africa. Though Nigeria has been a democracy since 1999, the wider Sahel is seeing a "coup contagion," fuelled by the unfounded belief that democratic governments cannot guarantee security or economic stability.[1] [2] [3]

- Details
- Blog
By Ayobami Ayorinde, Maryam Ibrahim and Seyi Akinbodewa | Internally Generated Revenue (IGR) remains a critical indicator of the fiscal sustainability and economic independence for subnational governments. It shows how well each state can raise funds on its own beyond what it receives from the federation pool and how that capacity continues to change over time.

- Details
- Blog
By Cynthia Rowe | Policy dialogues like this are more than just events. They’re spaces where ideas meet action, and where reform begins—not in documents, but in dialogue. They remind us that active citizenship is not a luxury, but a necessity for national development.

Agora Policy is a Nigerian think tank and non-profit committed to finding practical solutions to urgent national challenges.