
By Ayobami Ayorinde, Maryam Ibrahim and Oluchi Nkeonye | Around the middle of July, the Federation Account Allocation Committee (FAAC) shared the revenue generated for the month of June 2026 among the three tiers of government and other statutory recipients. This allocation marks the end of the first half of the 2026 fiscal year, providing an opportunity to examine how FAAC disbursements have evolved over the past six months. In this analysis, we review allocation trends from January to June of 2026 and highlight the implications for fiscal management across the three tiers of government.
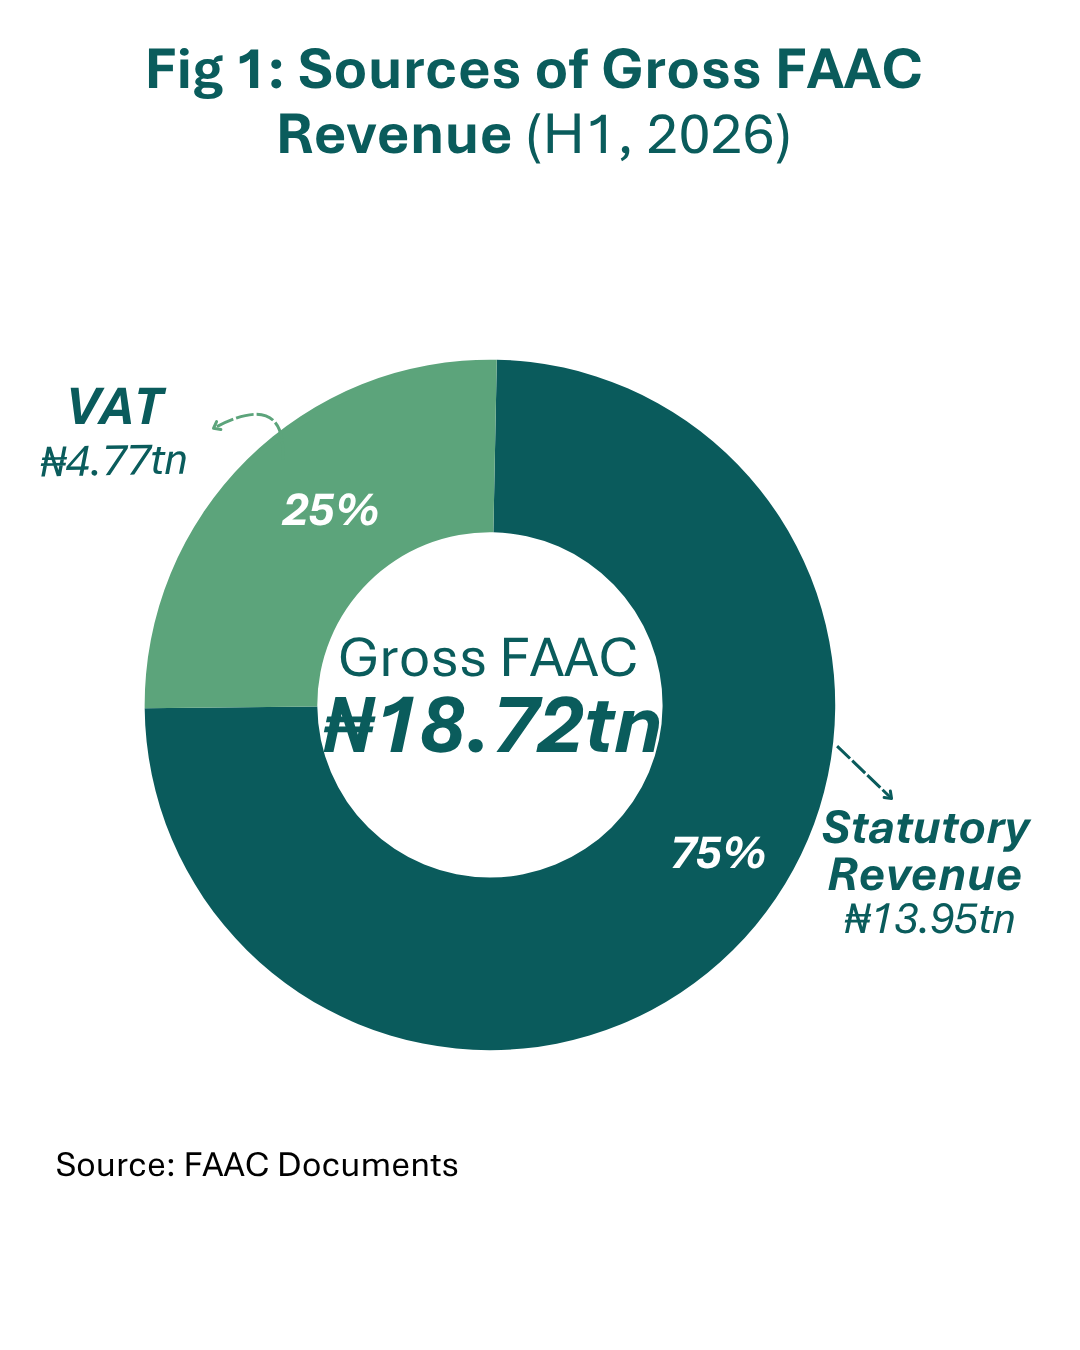
The total gross FAAC revenue in the first half of 2026 was ₦18.72 trillion. Statutory revenue remained the dominant source of FAAC receipts, contributing ₦13.95 trillion, which is equivalent to 75% of the total gross revenue, while VAT accounted for ₦4.77 trillion (25%) as shown in Fig 1.
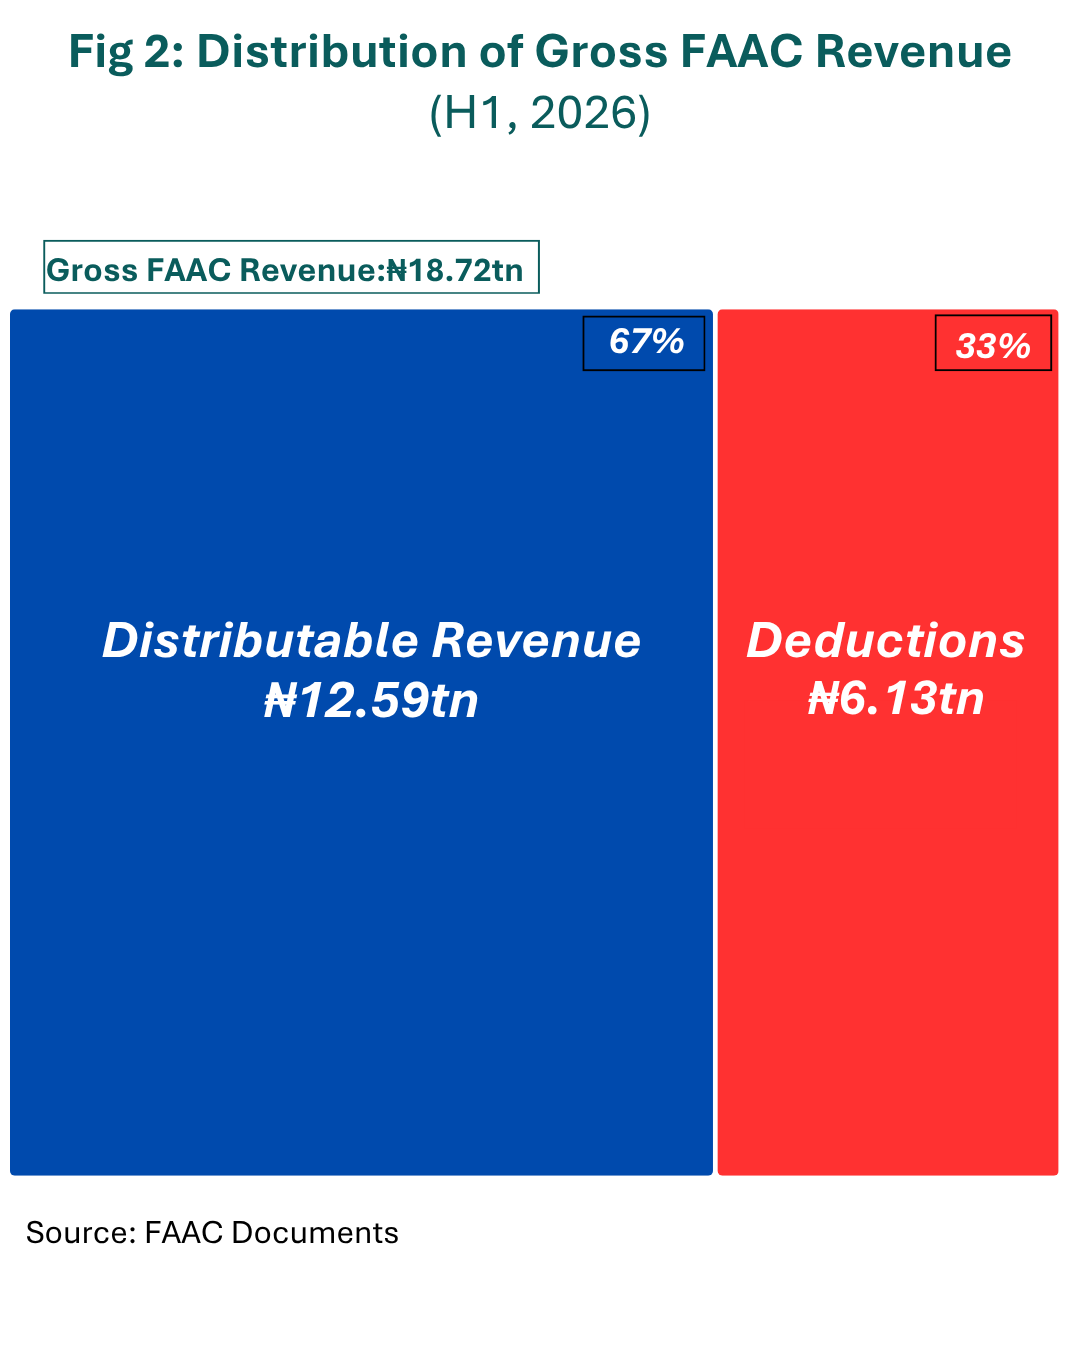
Of the total gross revenue generated during the period, ₦12.59 trillion (67%) was available for distribution to the three tiers of government, while the remaining ₦6.13 trillion (33%) was deducted for savings, interventions, refunds, transfers, and the cost of collection, as seen in Fig 2.
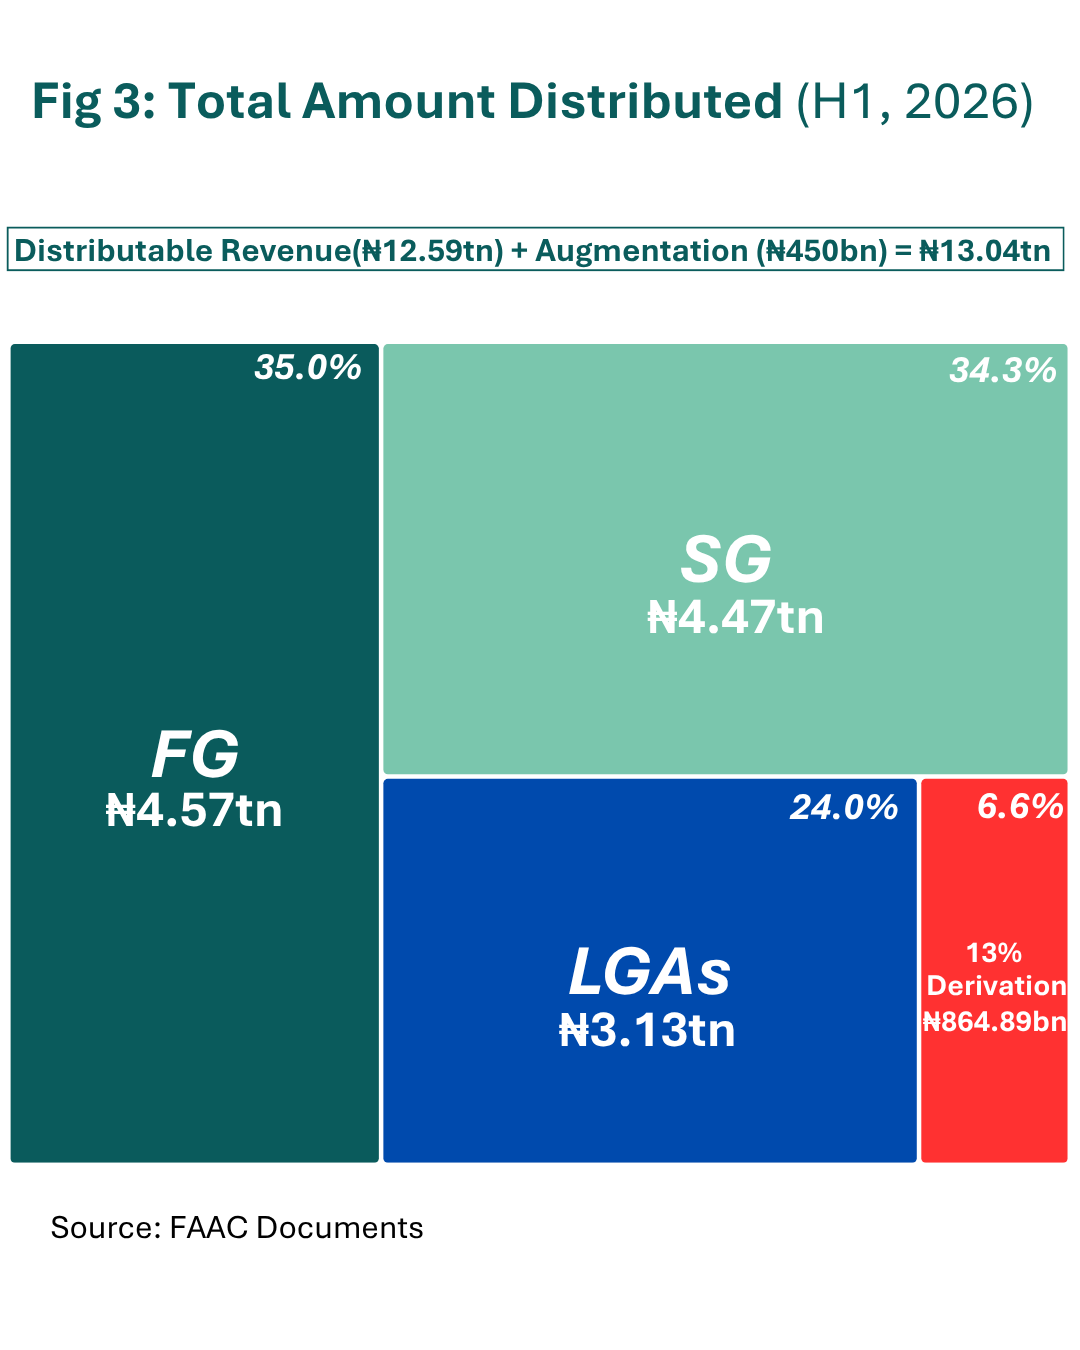
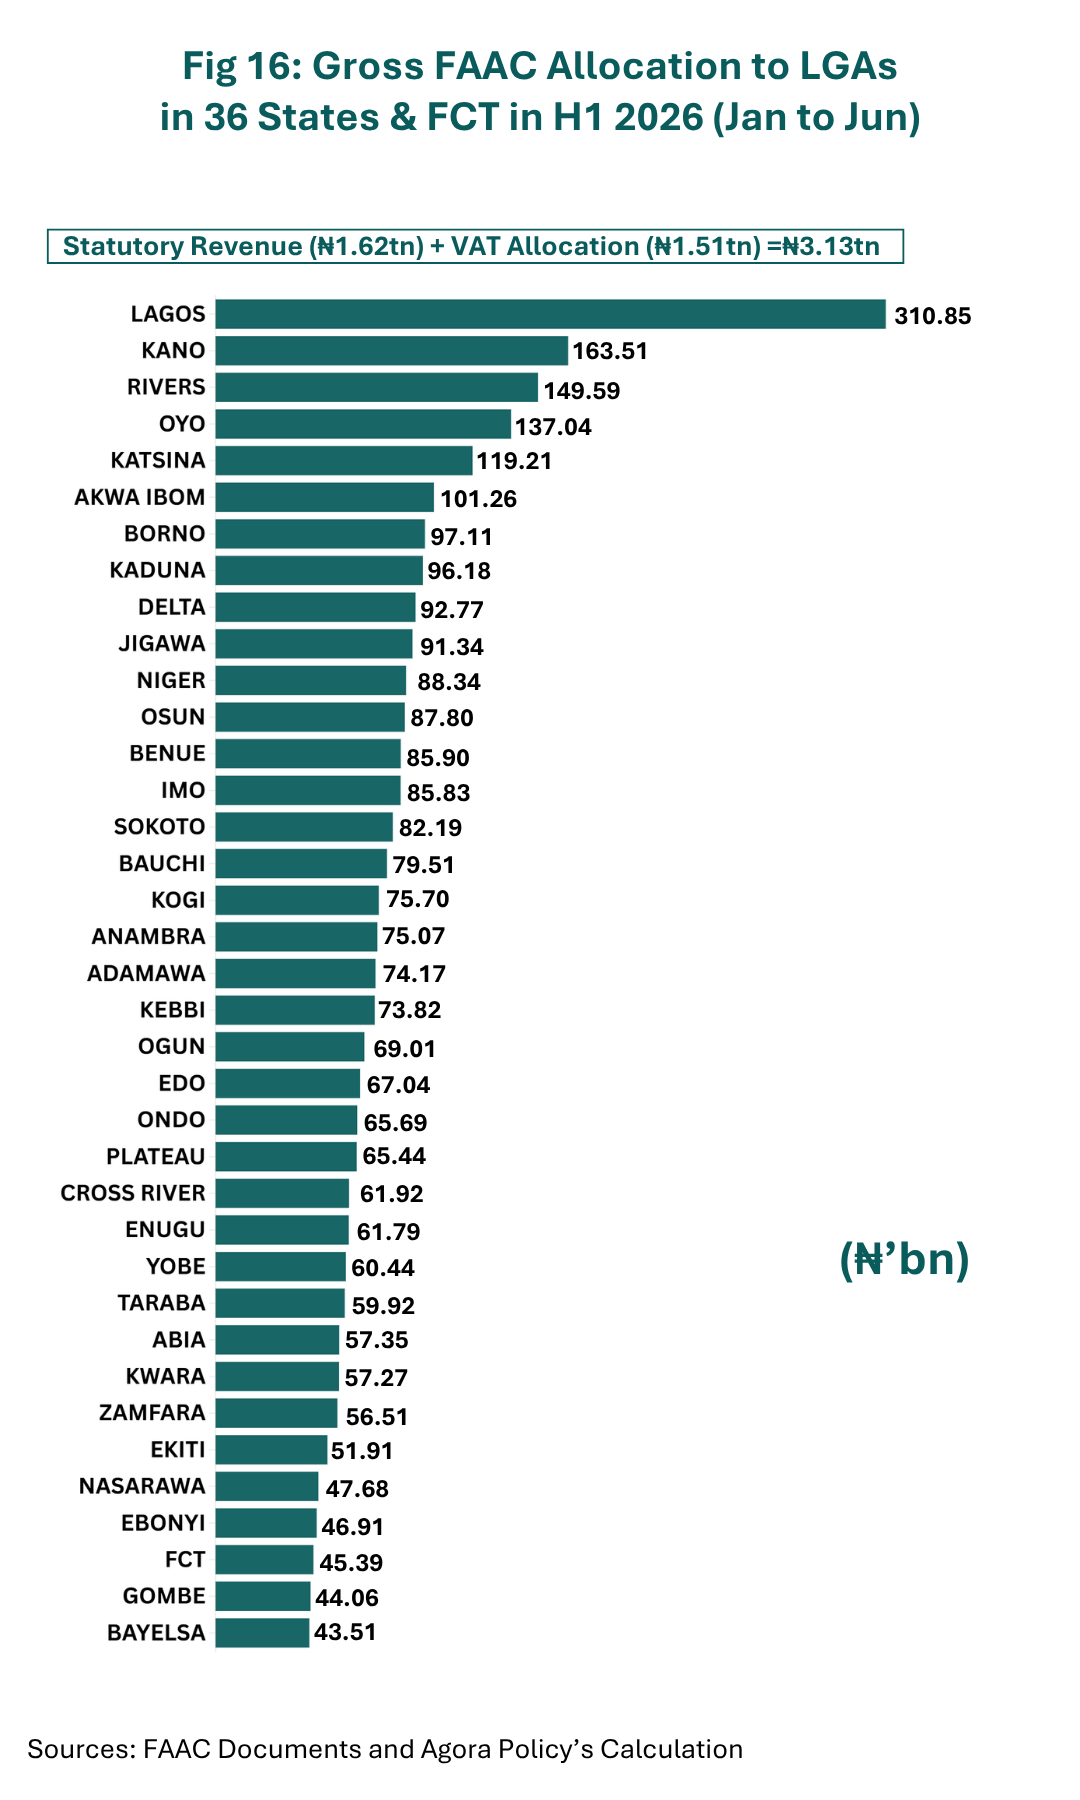
The total distributable revenue and augmentation for the first half of 2026 was shared across the three tiers of government. The Federal Government received ₦4.57 trillion while the 36 states shared ₦4.47 trillion. The 774 Local Government Areas received ₦3.13 trillion while the 13% derivation allocation to oil-producing states amounted to ₦864.89 billion, as shown in Fig 3.
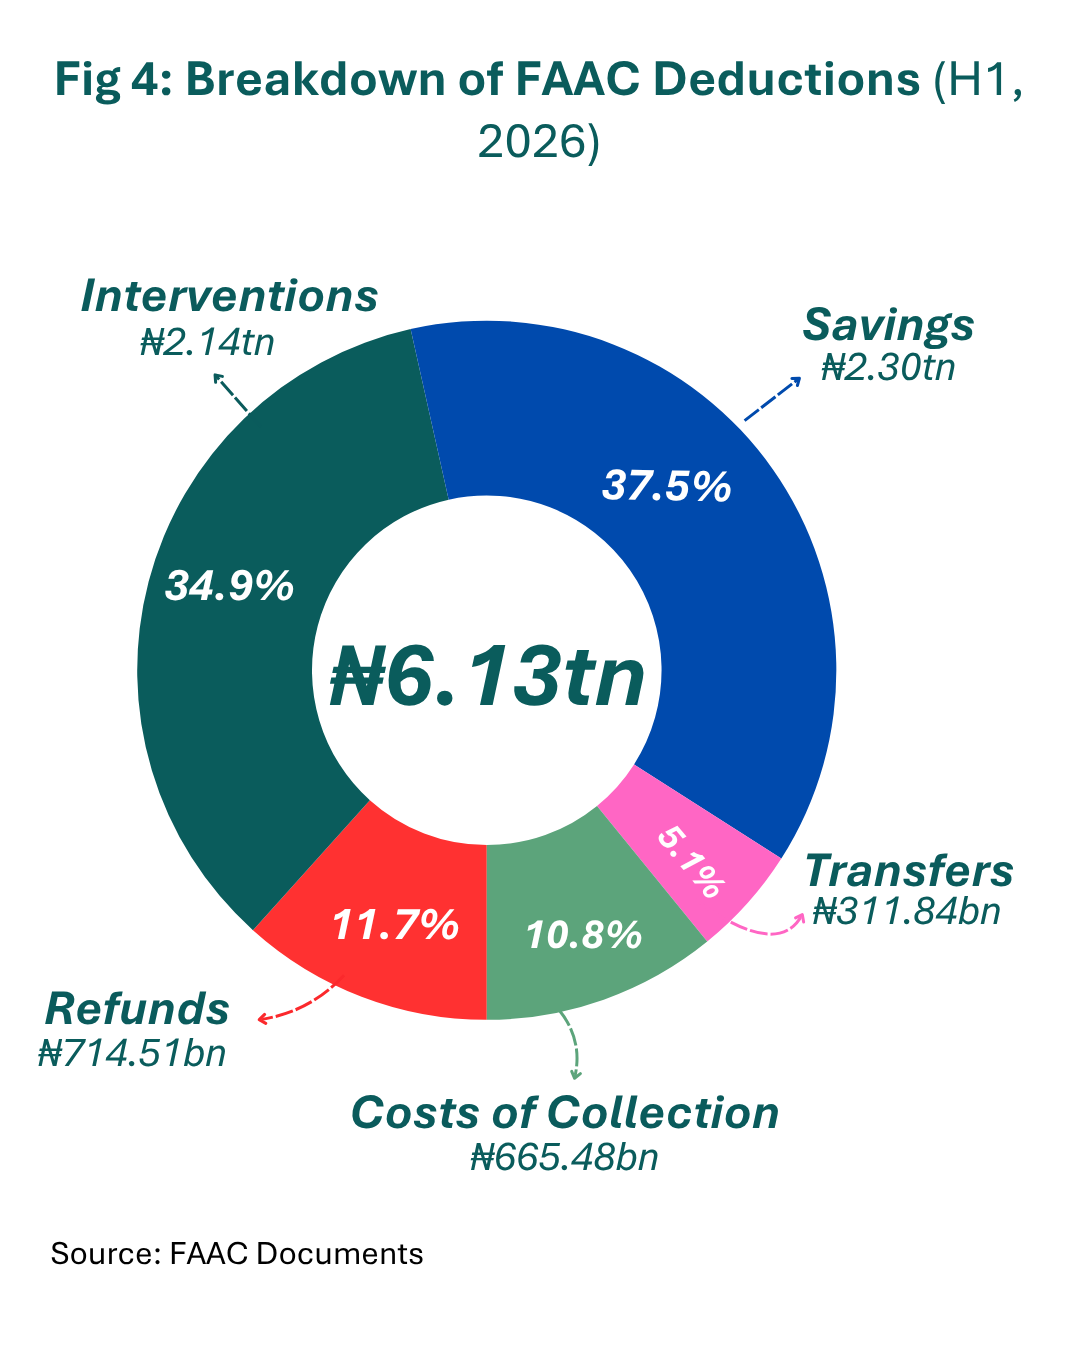
An analysis of the deductions shows that Savings and Interventions accounted for the largest share, amounting to ₦2.30 trillion and ₦2.14 trillion, respectively. These two represented the bulk of all deductions made during the period. Refunds followed at ₦714.51 billion while the Cost of Collection stood at ₦665.48 billion. Transfers, at ₦311.84 billion, were the smallest deduction in the first half of the year, as shown in Fig 4.
Below are some insights from FAAC Disbursements in the first half of 2026.
Half-Year Gross FAAC Revenue Increased by over 300% in Six Years
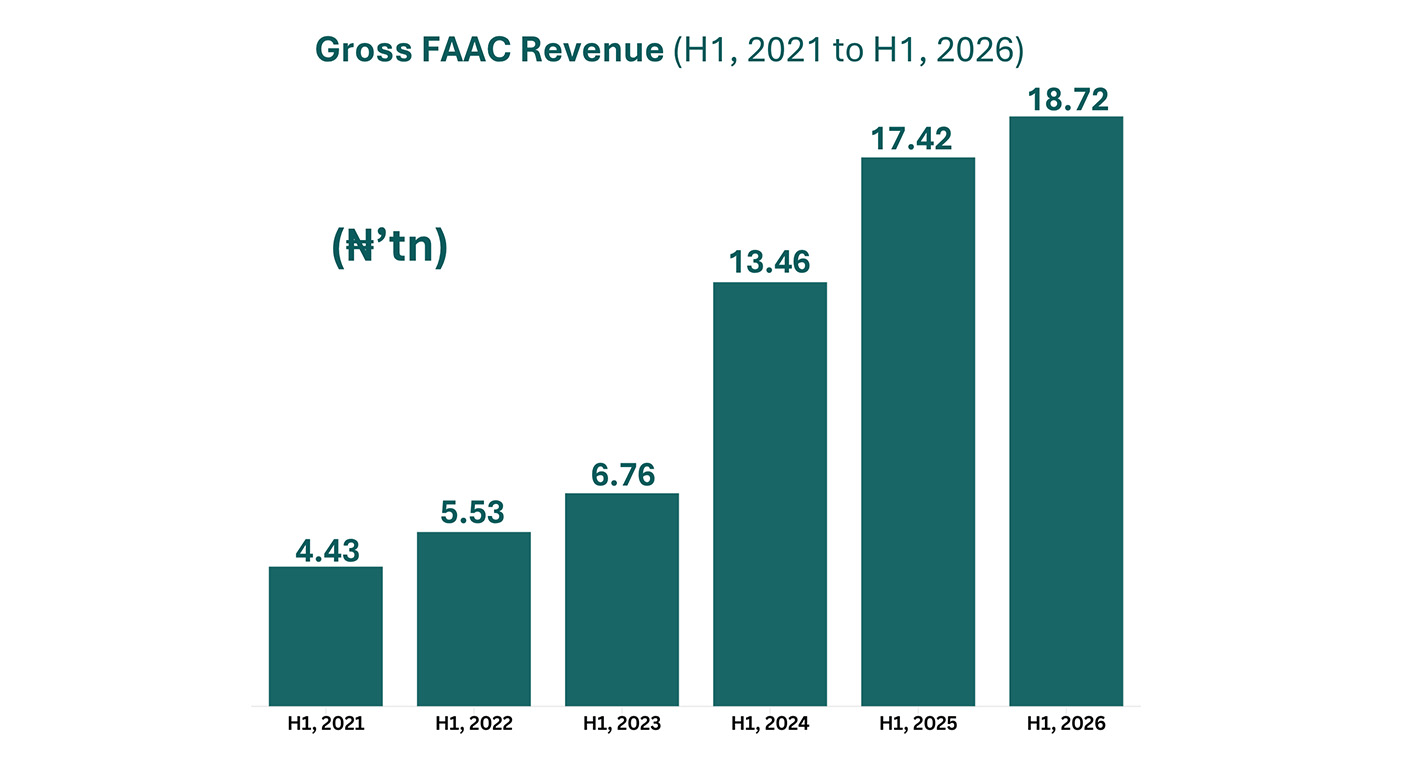
Between the first half of 2021 and the first half of 2026, gross FAAC revenue increased significantly by 323% from ₦4.43 trillion to ₦18.72 trillion as seen in Fig 5. More interesting is that the ₦18.72 trillion generated in just the first six months of 2026 exceeded the entire gross FAAC revenue recorded in each of 2021, 2022, and 2023 in nominal terms as shown in Fig 6.

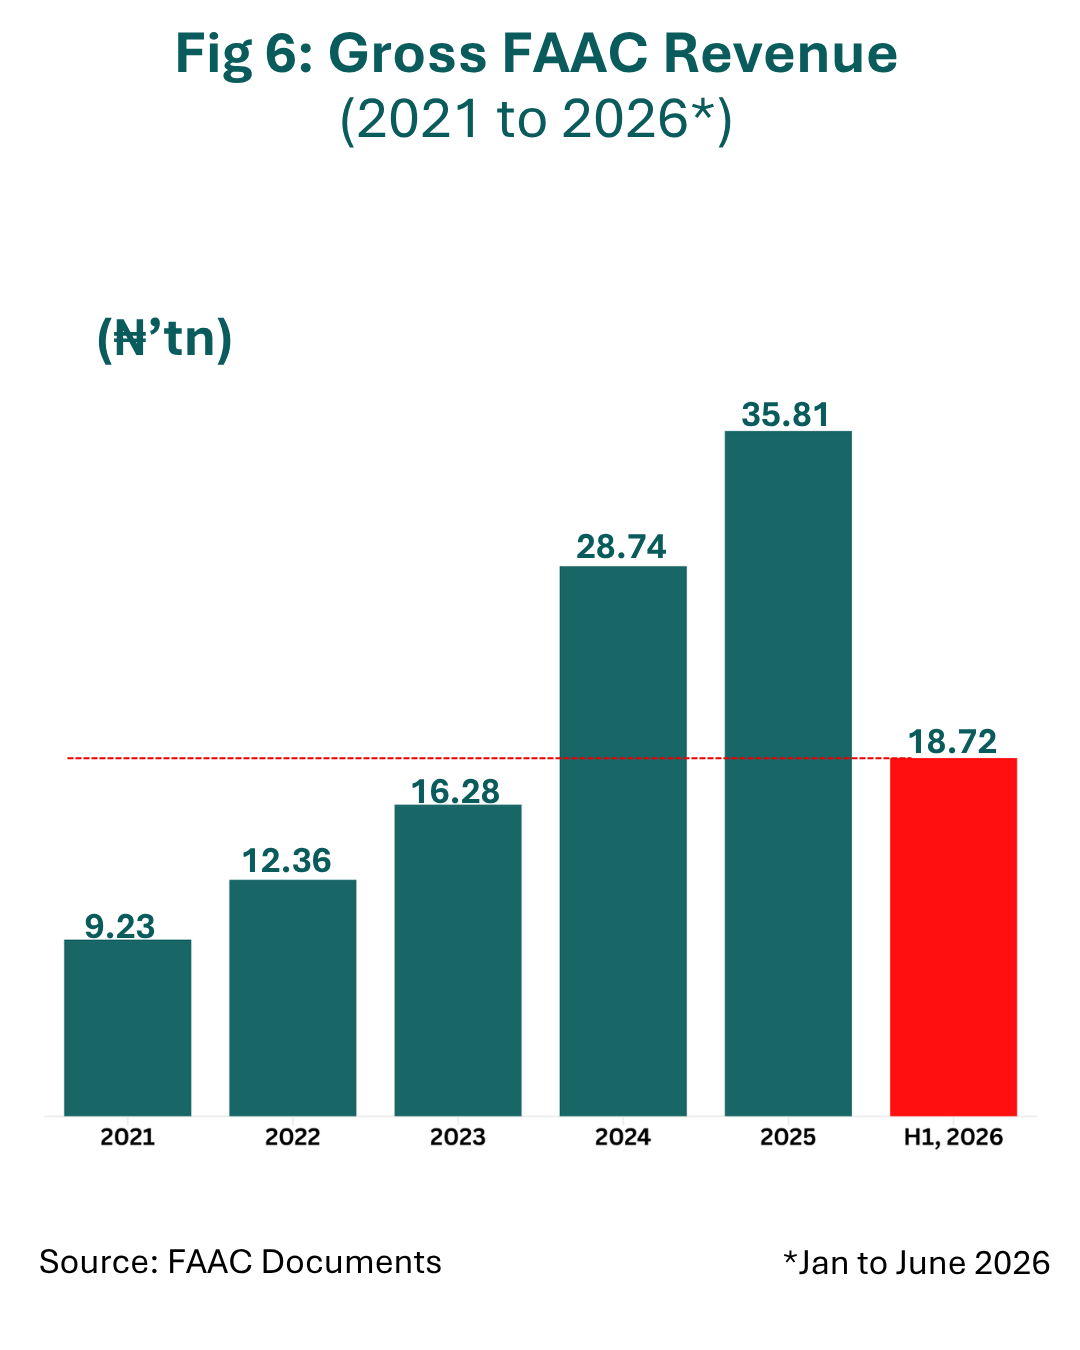
The ₦18.72 trillion generated between January and June 2026 represents 52% of the ₦35.81 trillion gross FAAC revenue recorded for the whole of 2025. If this trend of revenue performance continues in the second half of the year, the gross FAAC revenue for 2026 may exceed that of 2025.
Increase in Distributable Revenue, Decrease in Deductions
Distributable revenue in the first half of 2026 rose by 24.4% from ₦10.12 trillion in H1 2025 to ₦12.59 trillion in H1 2026 as seen in Fig. 7 below. Over the same period, FAAC deductions declined by 16%, falling from ₦7.30 trillion in the first half of 2025 to ₦6.13 trillion in the corresponding period of 2026 as shown in Fig. 8.

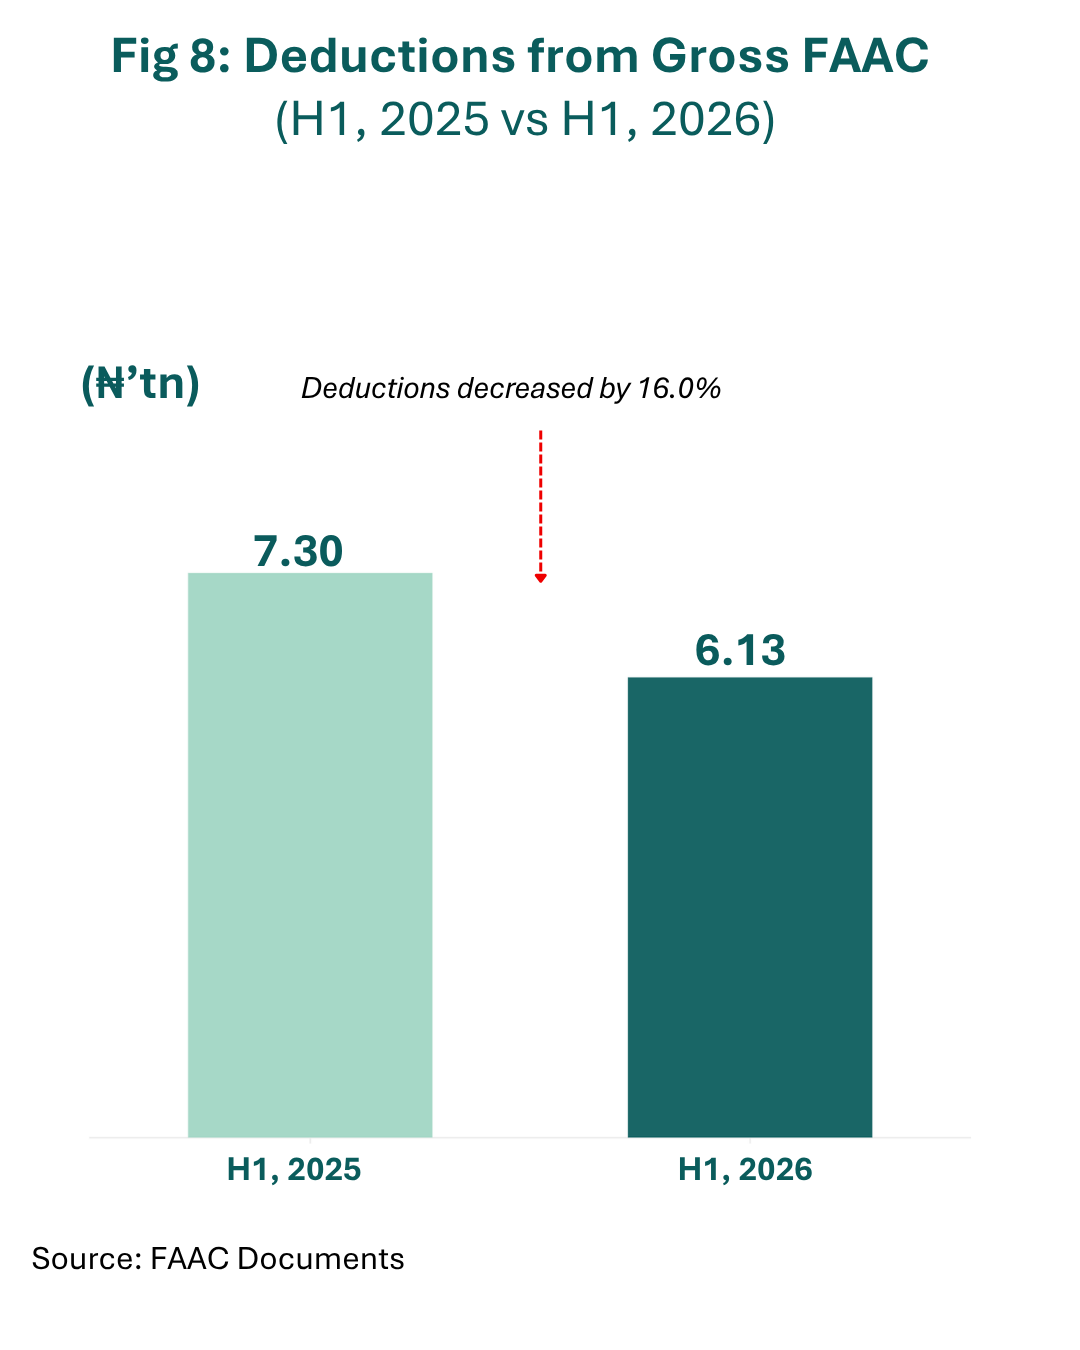
As a result, a larger share of Gross FAAC revenue was available for distribution, with distributable revenue accounting for 67% of Gross FAAC in H1 2026, up from 57% in the same period of 2025.
Less Refunds, More Savings
A notable highlight in FAAC revenue during the first half of 2026 was the sharp decline in refunds as seen in Fig 9. Refunds fell by 80% compared to the corresponding period in 2025, significantly reducing its share of FAAC deductions. In H1 2025, refunds, largely comprising payments to states and local governments, accounted for 47% of total FAAC deductions. By H1 2026, that share had dropped to just 12%.
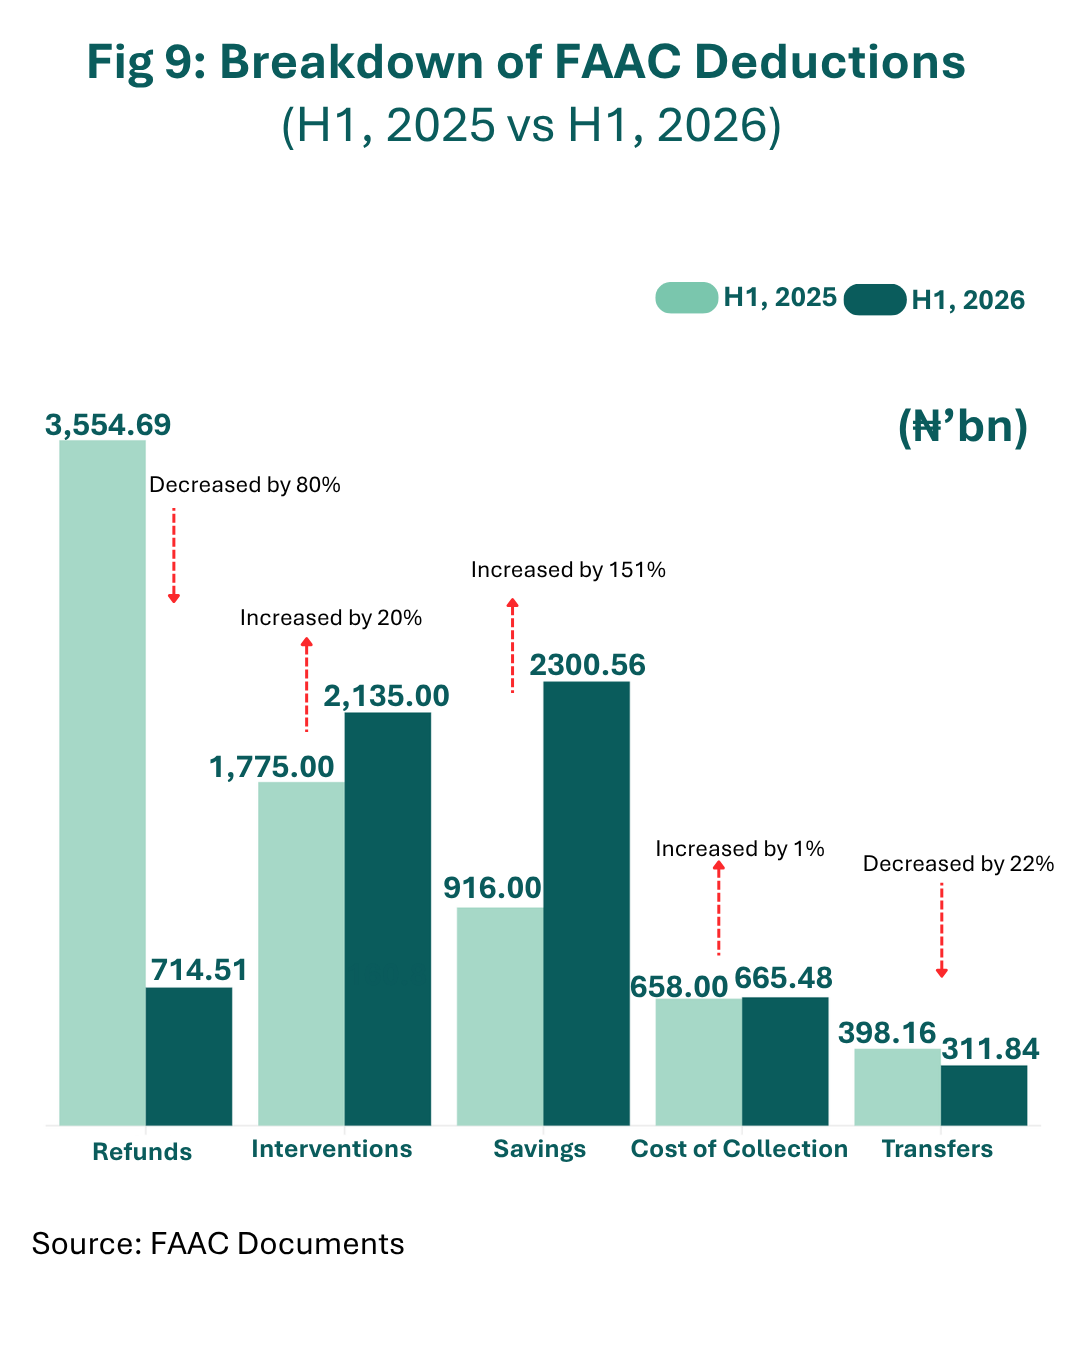
On the other hand, savings from Gross FAAC revenue increased substantially by 151% and became the largest component of FAAC deductions in H1 2026, accounting for 37% of total deductions from 15% in the corresponding period of 2025. Despite this, more money was allocated to Interventions between April to June 2026, particularly for national and state security, and state infrastructure. The breakdown of allocations to Interventions in the first half of 2026 is as follows: National Security Fund (₦ 1 trillion), Infrastructure Development Fund for States (₦777 billion), Military Intervention Fund (₦250 billion) and Intervention for State Security (₦108 billion).
Federal Government Regains Largest Share of Distributable FAAC Revenue
The distribution of Gross FAAC revenue shifted in favour of the Federal Government in the first half of 2026. Unlike the corresponding period of 2025, when the 36 states collectively received a slightly larger share of distributable FAAC allocations than the federal government, the federal government regained the top spot in H1 2026. In H1 2025, the states received a combined ₦3.43 trillion, marginally exceeding the Federal Government's ₦3.39 trillion as shown in Fig 10 below.

However, in H1 2026, the Federal Government's allocation increased to ₦4.57 trillion, surpassing the ₦4.47 trillion allocated to the states combined. However, a reallocation of the deductions (which go mostly to states) combined with derivation (which goes only to states), shows that the states get a higher portion of FAAC revenue than the FG.
June Remains the Month with the Highest Gross FAAC Revenue in the First Half of the Year
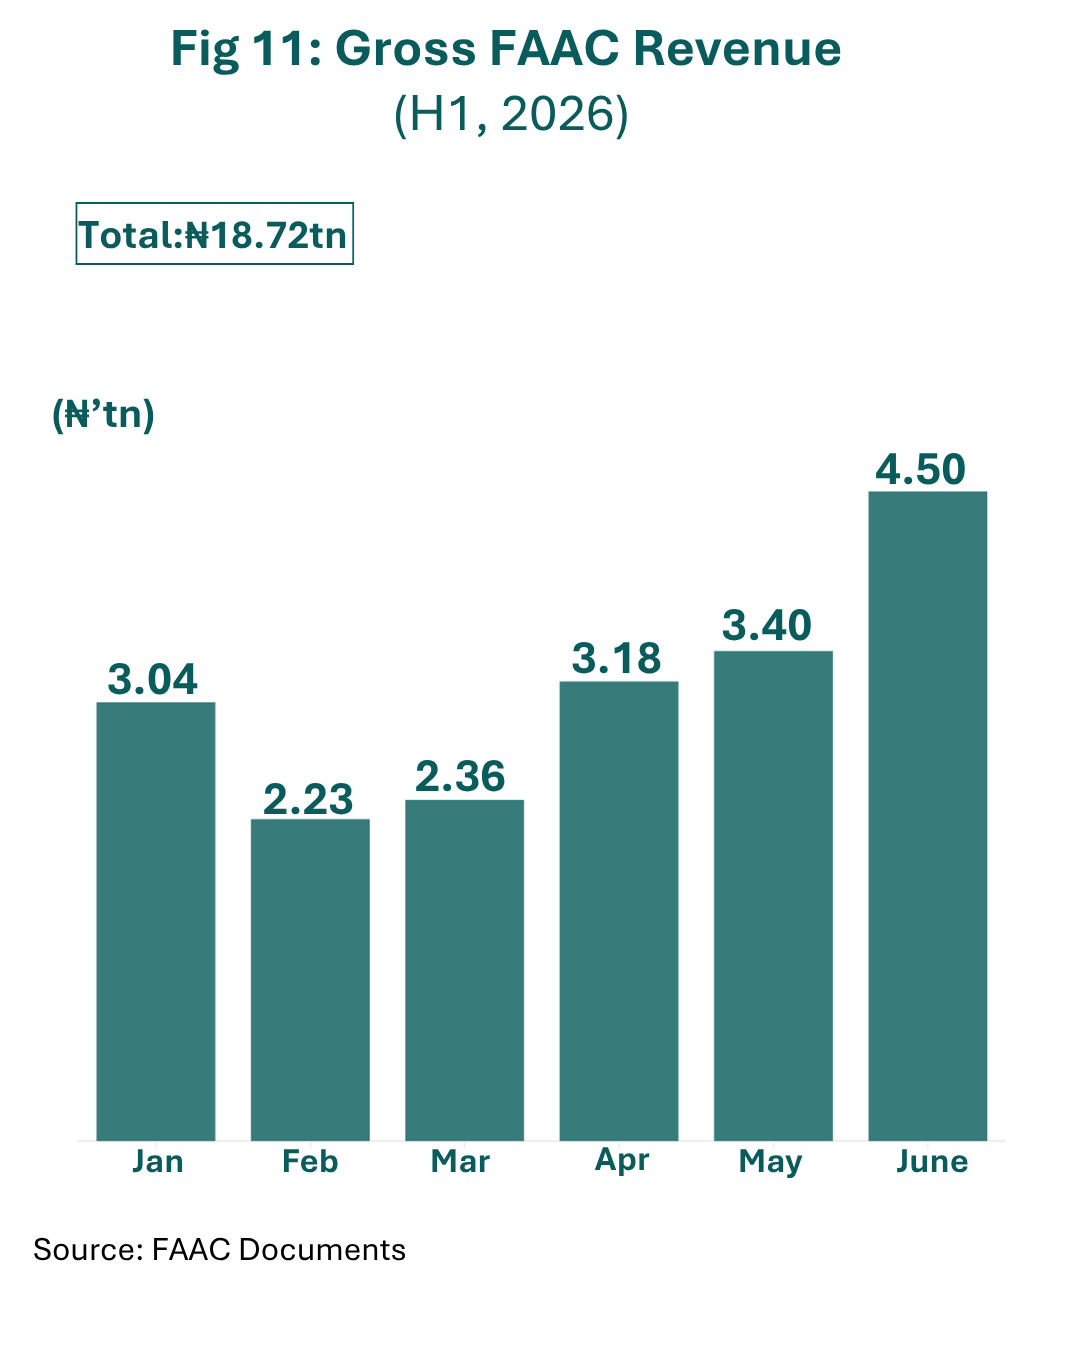
Just as it was in the first half of 2025, June recorded the highest Gross FAAC revenue in H1 2026 at ₦4.50 trillion as seen in Fig 11. This was likely driven by higher Company Income Tax (CIT) collections and other annual tax remittances typically due in June. In contrast, February recorded the lowest Gross FAAC revenue at ₦2.23 trillion, mirroring the trend observed in the corresponding period of 2025.
Lagos and Oyo Record the Highest Gross FAAC Increases
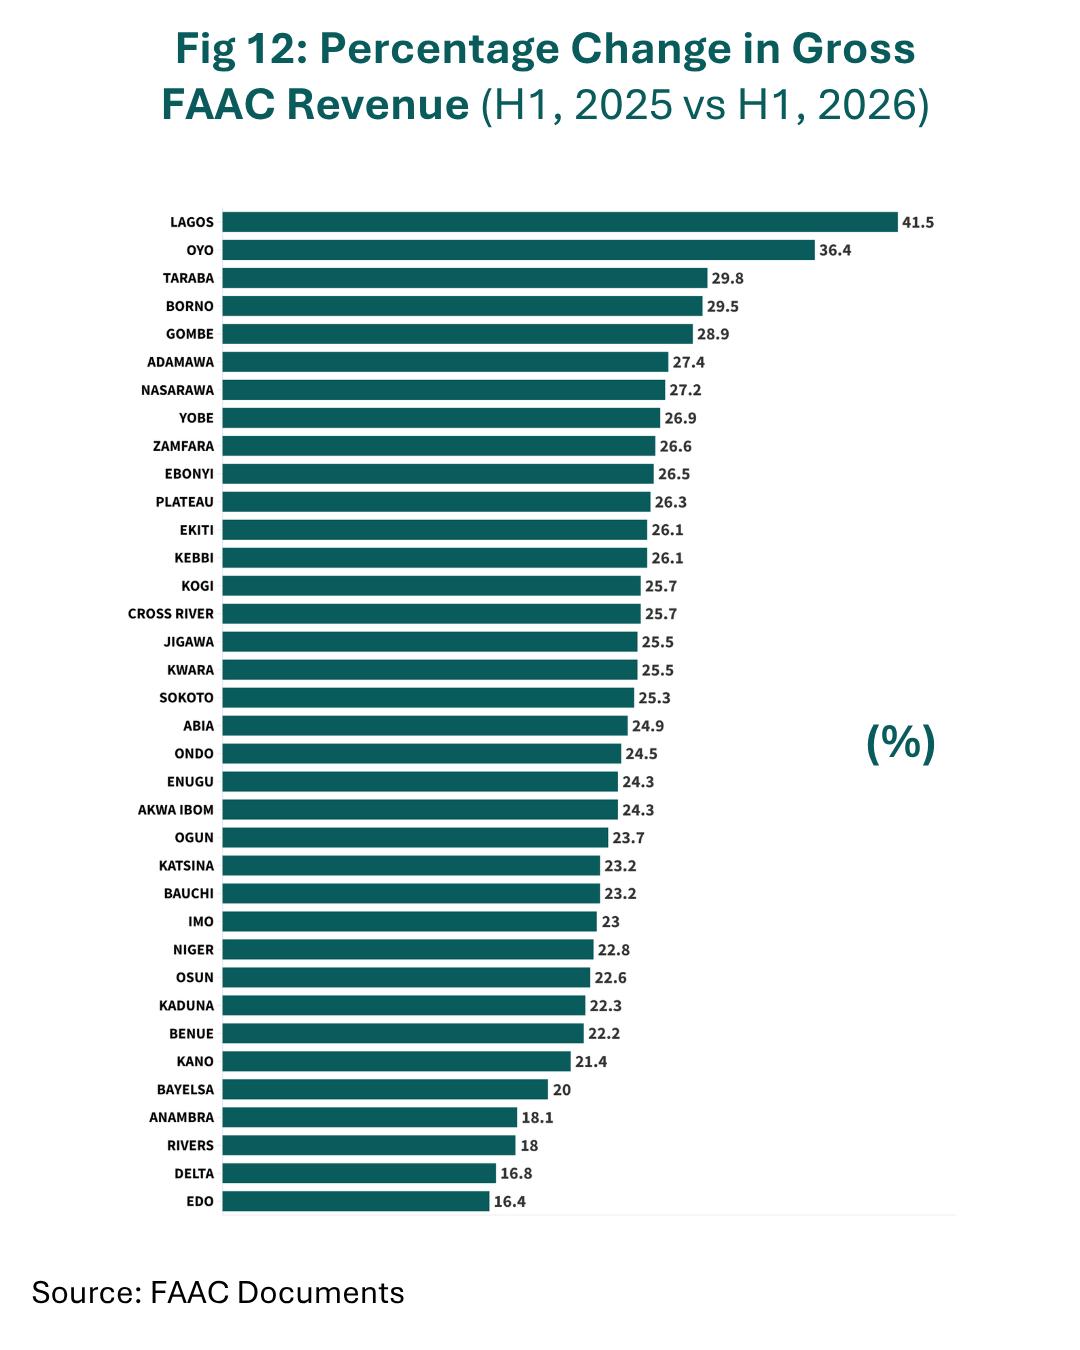
In terms of year-on-year growth, Lagos and Oyo states recorded the largest increases in Gross FAAC allocations by 41.5% and 36.4% respectively. By contrast, Edo and Delta posted the lowest increase with their allocations rising by 16.4% and 16.8%, respectively as shown in Fig 12.
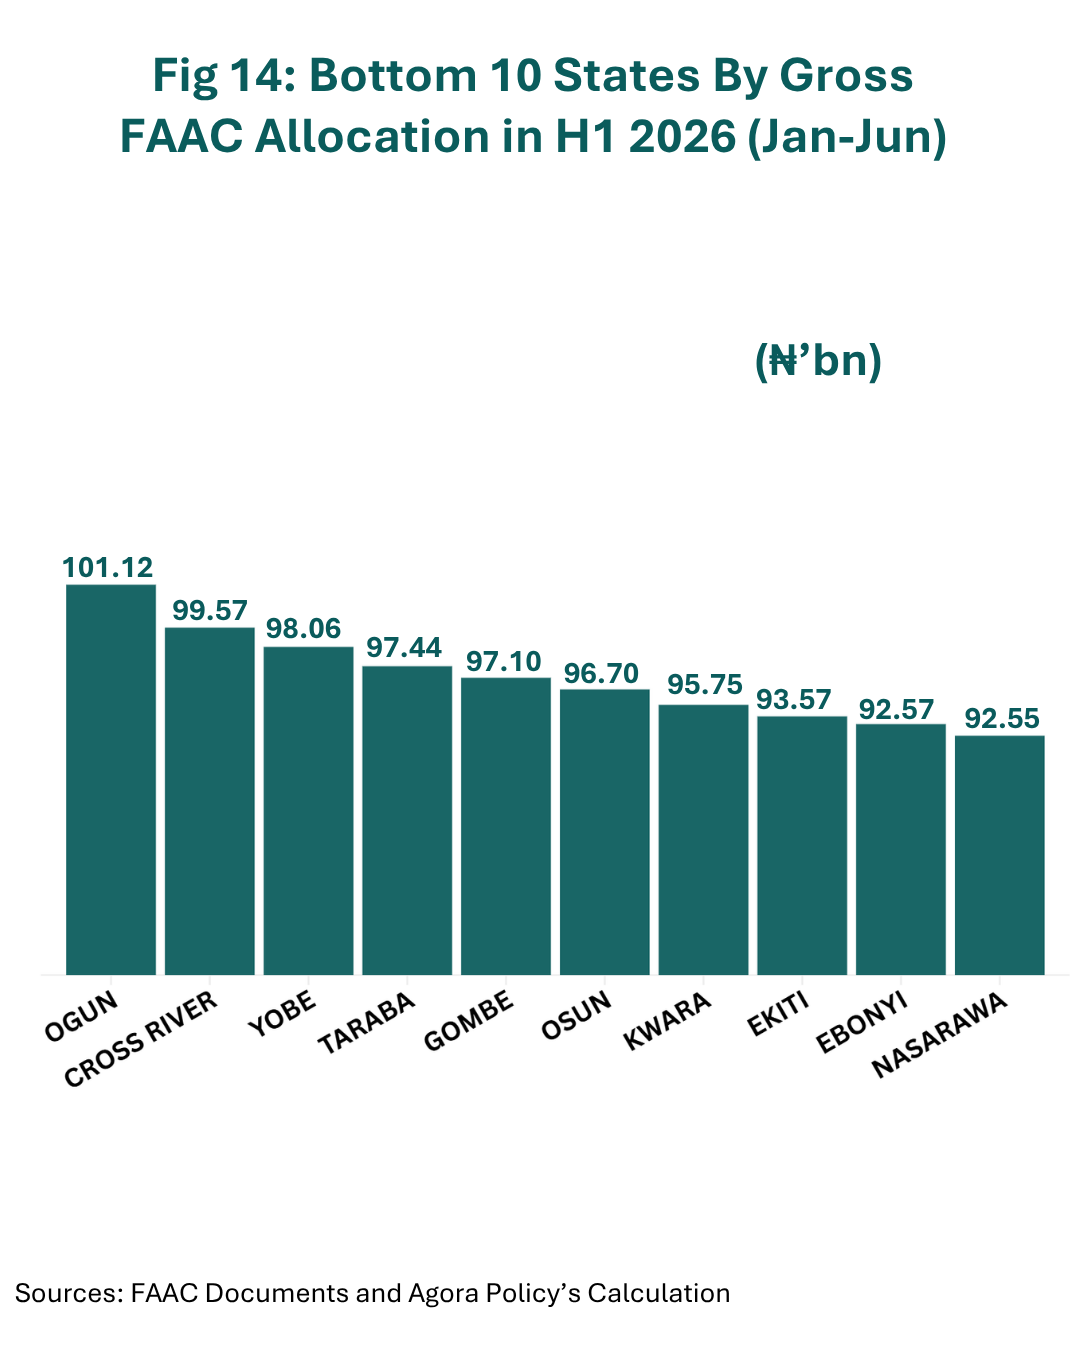
Meanwhile, Lagos remained the largest recipient of Gross FAAC allocations in the first half of 2026, receiving ₦477.05 billion, while Nasarawa received the least at ₦72.78 billion. The composition of the top and bottom recipients changed slightly compared to H1 2025. Ondo entered the top 10 states by Gross FAAC allocation, replacing Edo, which dropped out of the top 10. At the lower end of the ranking, Ogun joined the bottom 10 states, while Zamfara moved out of the group as seen in figures 13 and 14.

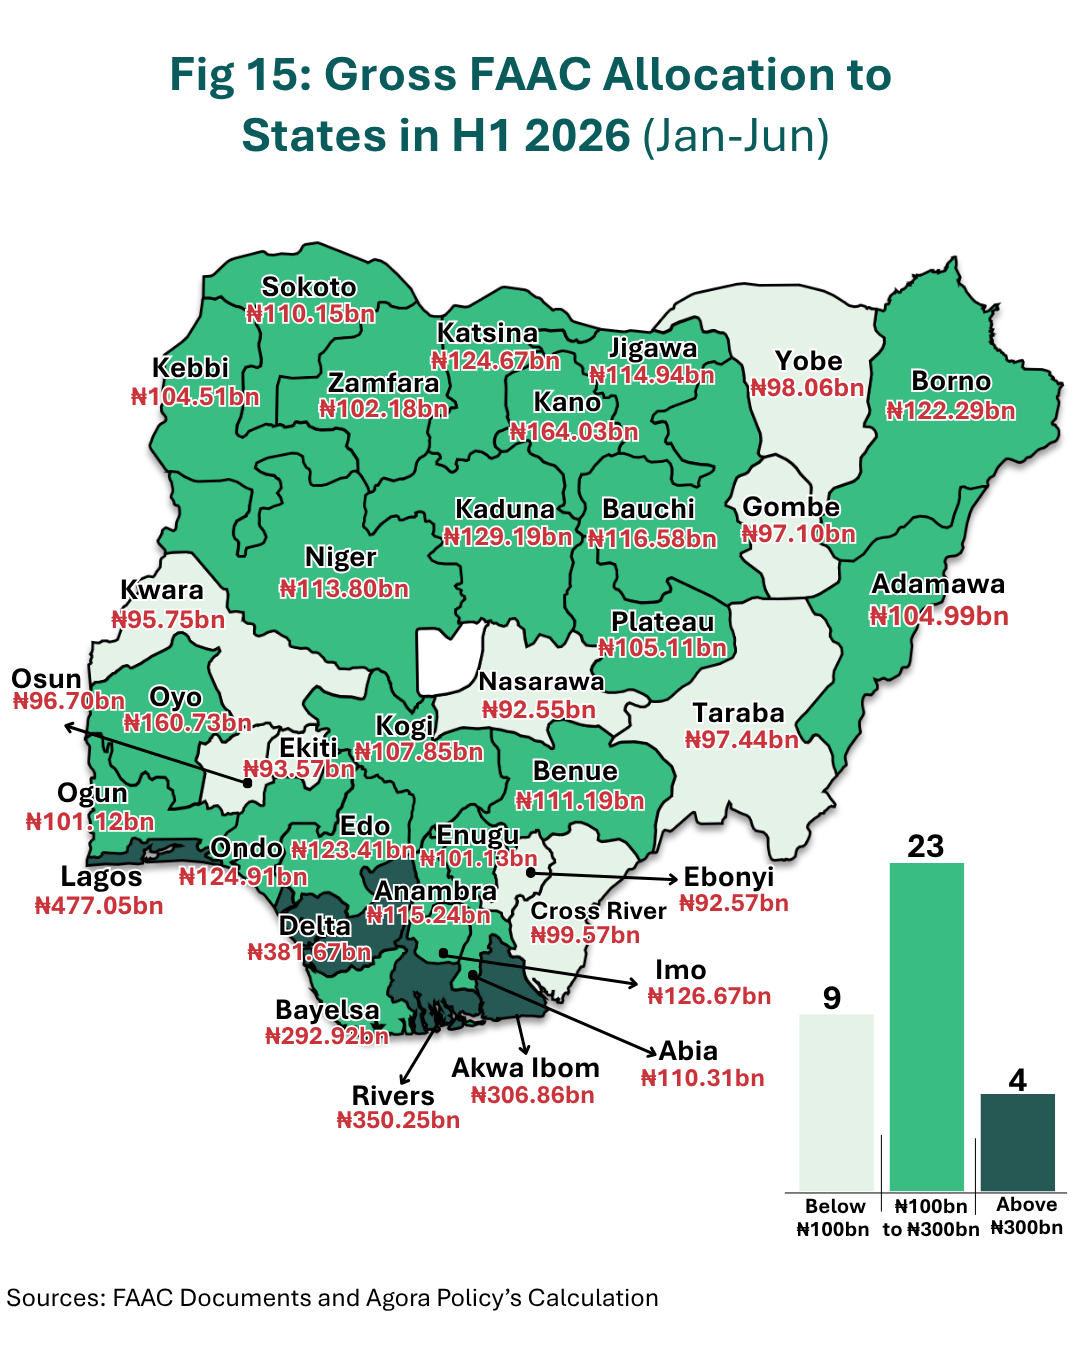
Twenty of the 36 states received between ₦100bn to ₦300bn in gross FAAC allocation. Nine states received less than ₦100bn while Lagos, Delta, Rivers and Akwa Ibom each received over ₦300bn as shown in Fig 15.
Having More LGAs Does Not Necessarily Mean Higher FAAC Revenue
Although Kano has the highest number of LGAs (44), its combined gross FAAC allocation of ₦163.5 billion to its LGAs was only the second highest and was nearly half of the ₦310.85 billion received by the 20 LGAs of Lagos. Similarly, Rivers, with 23 LGAs, received a higher gross FAAC allocation to its LGAs than Oyo and Katsina, despite having 33 and 34 LGAs, respectively, as seen in Fig 16. This pattern appears recent, and is likely on account of the growing prominence of Value Added Tax (VAT) as a source of FAAC revenue. LGAs receive 35% of VAT revenue, and states with urban and commercial LGAs with a high level of consumption, like Lagos and Rivers, stand at an advantage, even with fewer number of LGAs.
Conclusion
The first half of 2026 marked a marginally better FAAC performance than the corresponding period of 2025, with higher gross FAAC revenue, a larger distributable pool, and lower deductions. But improved allocations alone may not translate to better development outcomes unless accompanied by more efficient spending across the three tiers of government. Equally important is the need to strengthen transparency and accountability mechanisms to ensure that public resources deliver measurable value for citizens. Therefore, as revenues improve, the emphasis should increasingly shift from the size of allocations to how effectively public resources are deployed to improve infrastructure, public services and the welfare of Nigerians.