


By Maryam Ibrahim and Oluchi Nkeonye | The Federation Account Allocation Committee (FAAC) has completed the distribution of revenue for January to September 2026, following its October meeting. The figures show continued nominal revenue growth, but also volatile monthly receipts and a substantial shortfall in mineral revenue against budget. This analysis examines the sources of revenue, deductions and allocations across the three tiers of government, and considers the implications for fiscal planning and public services.
Gross FAAC revenue for January to September 2026 totalled ₦31.46 trillion. Statutory revenue contributed ₦24.25 trillion, or 77.1%, while value added tax (VAT) contributed ₦7.21 trillion, or 22.9% (Figure 1). All monetary comparisons in this analysis are in nominal terms.
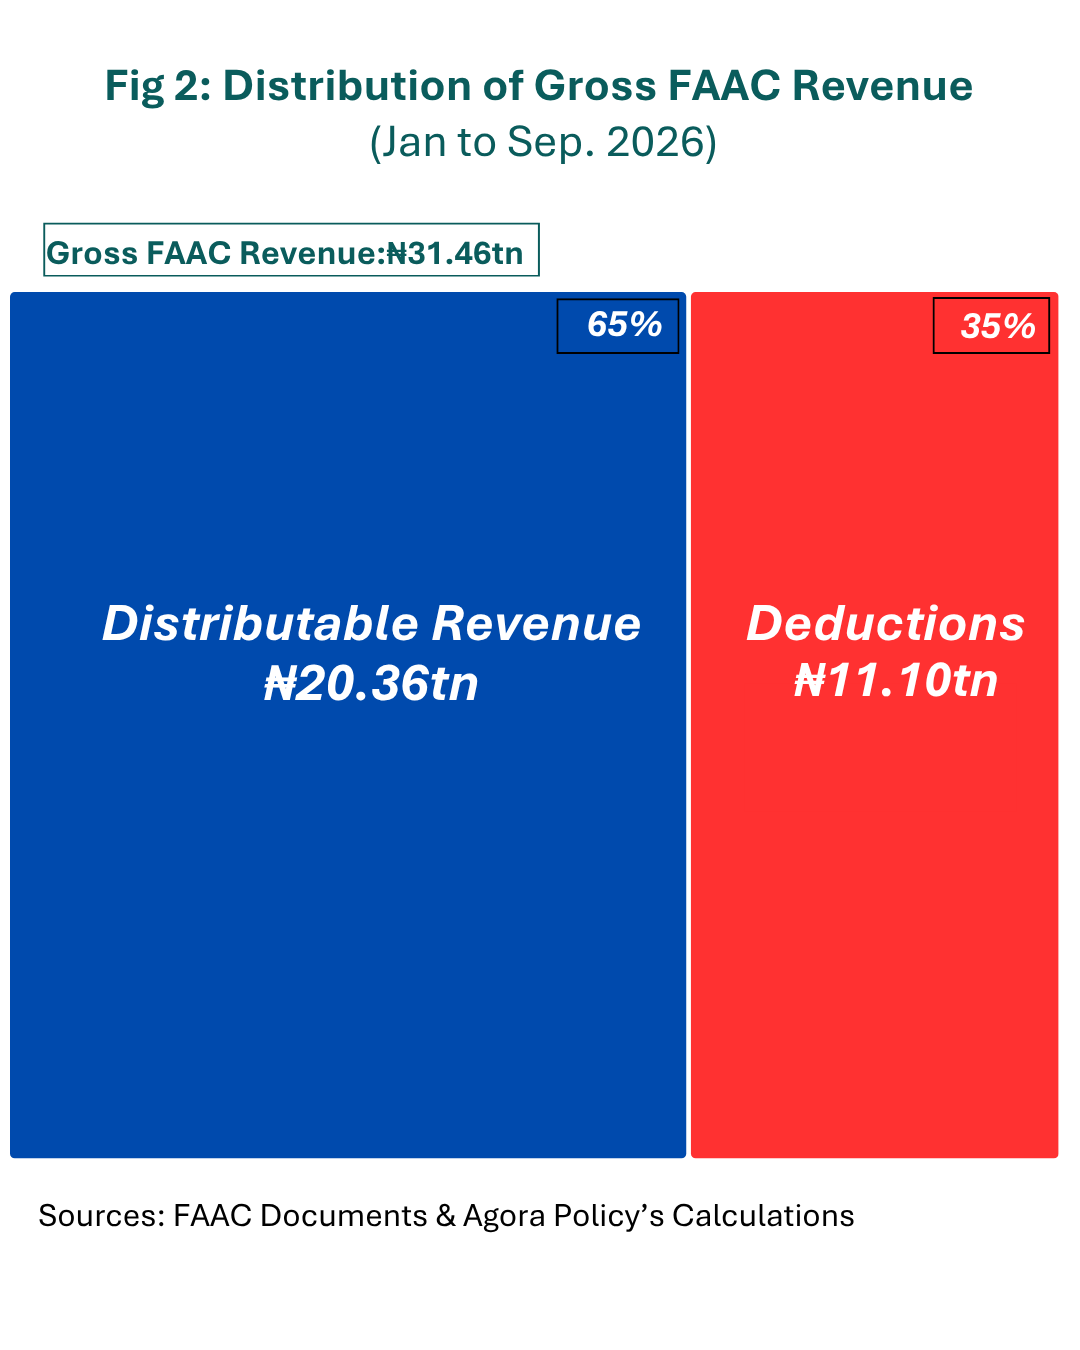
Of the gross revenue, ₦20.36 trillion, or 65 %, was available for distribution before augmentation. The remaining ₦11.10 trillion, or 35%, was deducted for savings, interventions, refunds, transfers and collection costs (Figure 2).

A further ₦450 billion in augmentation brought total distributions to ₦20.81 trillion. The Federal Government received ₦7.35 trillion; the states got ₦7.01 trillion; and local governments received ₦4.92 trillion. A further ₦1.53 trillion went to oil-producing states under the 13% derivation provision. Derivation is shown separately in the distribution breakdown, although it also accrues to state governments (Figure 3).
Interventions accounted for the largest deduction, at ₦4.78 trillion, followed by savings at ₦3.56 trillion. In nine months, refunds amounted to ₦1.21 trillion and collection costs to ₦1.09 trillion. Transfers, at ₦469.06 billion, were the smallest category (Figure 4).


The figures reveal several important trends in revenue growth, budget performance and the distribution of resources. Ten of these trends and patterns are discussed below.
1. Gross revenue is rising but growth is slowing
Gross FAAC revenue increased by ₦3.51 trillion, or 12.6%, from ₦27.95 trillion in January–September 2025 to ₦31.46 trillion in the corresponding period of 2026 (Figure 5). In nominal terms, the latest nine-month total is about 4.6 times the 2021 figure, equivalent to compound annual growth of 35.5%. However, annual growth peaked in 2024 and has roughly halved in each subsequent year. The ₦3.51 trillion increase in 2026 was less than half the ₦8.97 trillion increase recorded in the corresponding period of 2024.
The sharp rise in 2024 followed the exchange-rate and fuel-subsidy reforms introduced in 2023. These reforms provide a plausible explanation for part of the increase in naira receipts. Tax reform implementation and higher oil prices associated with the conflict in Iran may also have supported revenue in 2026. The aggregate figures alone, however, do not establish how much each factor contributed.

2. Nine months of revenue exceeded four of the previous five annual totals
Gross FAAC revenue for the full year rose from ₦9.23 trillion in 2021 to ₦35.81 trillion in 2025 (Figure 6). The largest annual increase occurred in 2024, when revenue rose by 76.5%, from ₦16.28 trillion in 2023 to ₦28.74 trillion in 2024. By September 2026, cumulative revenue of ₦31.46 trillion had exceeded the full-year totals for 2021, 2022, 2023 and 2024, and reached approximately 88% of the 2025 total.
The 2026 nine-month figure was 240.8% above the 2021 annual total, 154.5% above 2022’s, 93.2% above 2023’s and 9.5% above 2024’s. It should be borne in mind that these changes are in nominal terms, and not like-for-like measures of annual growth or purchasing power.
Average monthly revenue in January–September 2026 was ₦3.50 trillion, compared with ₦2.98 trillion over the whole of 2025. If the nine-month pace continues, full-year gross revenue would reach approximately ₦41.95 trillion. This is a simple annualization, not a forecast, as averages do not take account of seasonal revenue peaks. Also, other factors like oil price and exchange rate may increase or reduce the revenue outturns for the remaining three months of the year.

3. Third quarter revenue was highest but quarterly growth slowed
Monthly gross revenue ranged from ₦2.23 trillion in February to ₦5.15 trillion in July, a ratio of about 2.3 to one (Figure 7). Quarterly receipts rose from approximately ₦7.63 trillion in the first quarter to ₦11.08 trillion in the second and ₦12.75 trillion in the third. Growth slowed from about 45% between the first and second quarters to 15% between the second and third. September receipts of ₦3.91 trillion were 24% below the July peak. The revenue surge in June and July can be attributed to seasonality, as most companies pay their corporate income tax (CIT) in the middle of the year.
This volatility makes any single month a weak basis for recurring expenditure commitments. Governments should plan against a cautious revenue baseline and distinguish sustained gains from temporary increases.

4. Mineral and non-mineral statutory receipts were nearly equal
Statutory revenue contributed 77.1% of gross FAAC receipts, with VAT accounting for the remaining 22.9%. The statutory component comprised approximately ₦12.35 trillion in mineral revenue and ₦11.91 trillion in non-mineral revenue (Figure 8).
Mineral revenue accounted for about 39.2% of gross receipts, non-mineral statutory revenue for 37.9%, and VAT for 22.9%. Within statutory revenue, the mineral and non-mineral shares were approximately 50.9% and 49.1%, respectively. The near-even split within statutory revenue suggests a broader revenue base than one dominated by mineral receipts. This is a notable departure from the past when mineral revenue dominated not just statutory revenue but also gross FAAC revenue.

5. Mineral revenue accounted for most of the budget shortfall
Mineral revenue reached ₦12.35 trillion against the ₦27.98 trillion budget as shown in Figure 9. This represents 44.1% of the target and a shortfall of approximately ₦15.63 trillion. Non-mineral revenue performed better, reaching ₦11.91 trillion against ₦14.21 trillion budget, or 83.8% of the target.
The mineral revenue shortfall is largely explained by the production assumption in the budget. The 2026 budget used an oil-price benchmark of US$64.85 per barrel and a production assumption of 1.84 million barrels per day. The reported monthly production range of 1.48–1.77 million barrels per day falls below that assumption. Brent crude has sold for an average of $91 a barrel in 2026, which is $26.15 above the budget benchmark price. The shortfall in mineral revenue indicates that higher oil prices have not offset continued production weakness and/or optimistic production forecast.

Combined mineral and non-mineral receipts amounted to ₦24.26 trillion, or 57.5% of the combined ₦42.19 trillion budget, leaving a gap of ₦17.93 trillion. This shows that mineral revenue accounted for 87.17% of that gap. The comparison points to a substantial risk to spending plans.
6. Deductions fell modestly but their composition changed sharply
Deductions fell from ₦11.50 trillion in January–September 2025 to ₦11.10 trillion in the corresponding period of 2026, a decline of approximately 3.5%. Deductions’ share of gross revenue also fell from 41.1% in nine months of 2025 to 35.3% in the corresponding period in 2026. Consequently, distributable revenue before augmentation rose from ₦16.45 trillion to ₦20.36 trillion, an increase of 23.8%, compared with gross revenue growth of 12.6% (Figure 10).
The ₦3.91 trillion rise in distributable revenue exceeded the ₦3.51 trillion increase in gross receipts because deductions fell by approximately ₦400 billion. Lower deductions therefore contributed to the increase in resources available to the three tiers of government.

The modest fall in total deductions conceals a substantial change in their composition (Figure 11). Refunds fell by approximately ₦3.99 trillion, moving from the largest deduction category to the third-largest. Meanwhile, interventions and savings increased by approximately ₦3.75 trillion, from ₦4.59 trillion to ₦8.34 trillion. Together, interventions and savings accounted for 75.1% of deductions in nine months in 2026, compared with 39.9% in the corresponding period in 2025.

7. Federal receipts grew fastest while local governments lost share
Total distributions, including augmentation and the separately reported derivation allocation, rose from ₦16.45 trillion in January–September 2025 to ₦20.81 trillion in the same period of 2026. This was an increase of ₦4.36 trillion, or 26.5%. The 2026 figure includes ₦20.36 trillion in distributable revenue and ₦450 billion in augmentation.
The Federal Government recorded the largest increase in both absolute and percentage terms. Its receipts rose by approximately ₦1.70 trillion, or 30.0%, from ₦5.66 trillion to ₦7.36 trillion. Its share of total distributions increased from 34.4% to 35.3%. This is because deductions are made from statutory revenue where the federal government receives between 45.83% (mineral revenue after derivation) and 52.68% (non-mineral revenue). Lower deductions thus boost FG’s share of FAAC. Receipts for states rose by ₦1.48 trillion to ₦7.01 trillion, while its share increased slightly from 33.6% to 33.7% (Figure 12).
Local government receipts increased by ₦880.74 billion, or 21.8%, to ₦4.92 trillion. LGAs’ share of total distributions nevertheless declined from 24.5% to 23.6%, a fall of about 0.9%. Derivation receipts rose by 24.3% to ₦1.53 trillion, likely out of higher oil prices in most of 2026. It is worth noting that all categories received more allocations in nominal terms; the decline for LGAs was in relative share, not in the amount received. It is also worth noting that these changes do not indicate a change in the allocation formulas.

8. All states gained but larger recipients secured the biggest naira increases
The gross allocation to states was ₦8.43 trillion in January–September 2026, compared with ₦6.76 trillion a year earlier, an increase of approximately 24.7% (Figure 13). Every state recorded an increase, ranging from 16.3% in Anambra to 32.3% in Akwa Ibom (Figure 14).
Lagos and Delta recorded the largest naira gains, at ₦171.59 billion and ₦131.63 billion, respectively. Osun recorded the smallest, at ₦23.96 billion. A similar percentage increase produces a larger naira gain for a state with a larger starting allocation. Percentage growth and absolute gains therefore reveal different things.


9. Derivation and VAT explain the leading states
For January-September 2026, Lagos received ₦708.38 billion, followed by Delta with ₦649.53 billion, Rivers with ₦576.46 billion, Akwa Ibom with ₦515.32 billion and Bayelsa with ₦501.36 billion. Together, these five states got ₦2.95 trillion, or 35% of gross state allocations, up from 33.9% for the same period in 2025. They accounted for 39.6% of the increase in state allocations between 2025 and 2026 and occupied the same positions in both years (Figures 15–17).


The leading states have different revenue profiles. Statutory allocations, which includes 13% oil derivation, accounted for approximately 82–85% of receipts in Delta, Rivers, Akwa Ibom and Bayelsa. Lagos, by contrast, received ₦588.34 billion from VAT, equivalent to 83% of its ₦708.38 billion total and approximately 16.8% of the total VAT allocations to the states. These differences imply different exposures. Oil-linked receipts are particularly important to the leading South-South recipients, while VAT is especially important to Lagos.

10. The number of councils alone does not explain local government allocations
Local governments in four states received more than ₦200 billion in total: Lagos, ₦462.65 billion; Kano, ₦258.84 billion; Rivers, ₦230.04 billion; and Oyo, ₦213.24 billion. Together, they received approximately ₦1.16 trillion, or 23.7% of all local government allocations (Figures 18 and 19). It is important to note that these are totals for councils within each state, not allocations to the state governments.
Kano has 44 local government areas and Oyo has 33, but council numbers alone do not explain the ranking. Lagos has 20 local government areas, yet its councils received ₦13.96 billion more than the ₦448.69 billion received by the combined 78 councils in Kano (44) and Katsina (34). This is primarily because Lagos’ LGAs, like the state itself, receive the bulk of VAT revenue on account of derivation. The councils in the three highest-receiving states together received approximately ₦951.53 billion. That was ₦114.49 billion, or 13.7%, more than the ₦837.04 billion received by councils in the ten lowest-receiving states, excluding the Federal Capital Territory.


Conclusion
The first nine months of 2026 brought more nominal revenue and larger distributions to every tier of government. Lower deductions helped distributable revenue grow faster than gross receipts, while augmentation provided an additional boost. Nevertheless, monthly receipts remained volatile, mineral revenue fell well below budget, and deductions still absorbed more than a third of gross receipts.
Fiscal planning should therefore rest on realistic revenue assumptions. There is need for greater transparency and accountability on the reasons for and utilisation of some of the deductions, especially interventions and refunds. Governments across the board also need to show how larger allocations translate into better services and development outcomes.